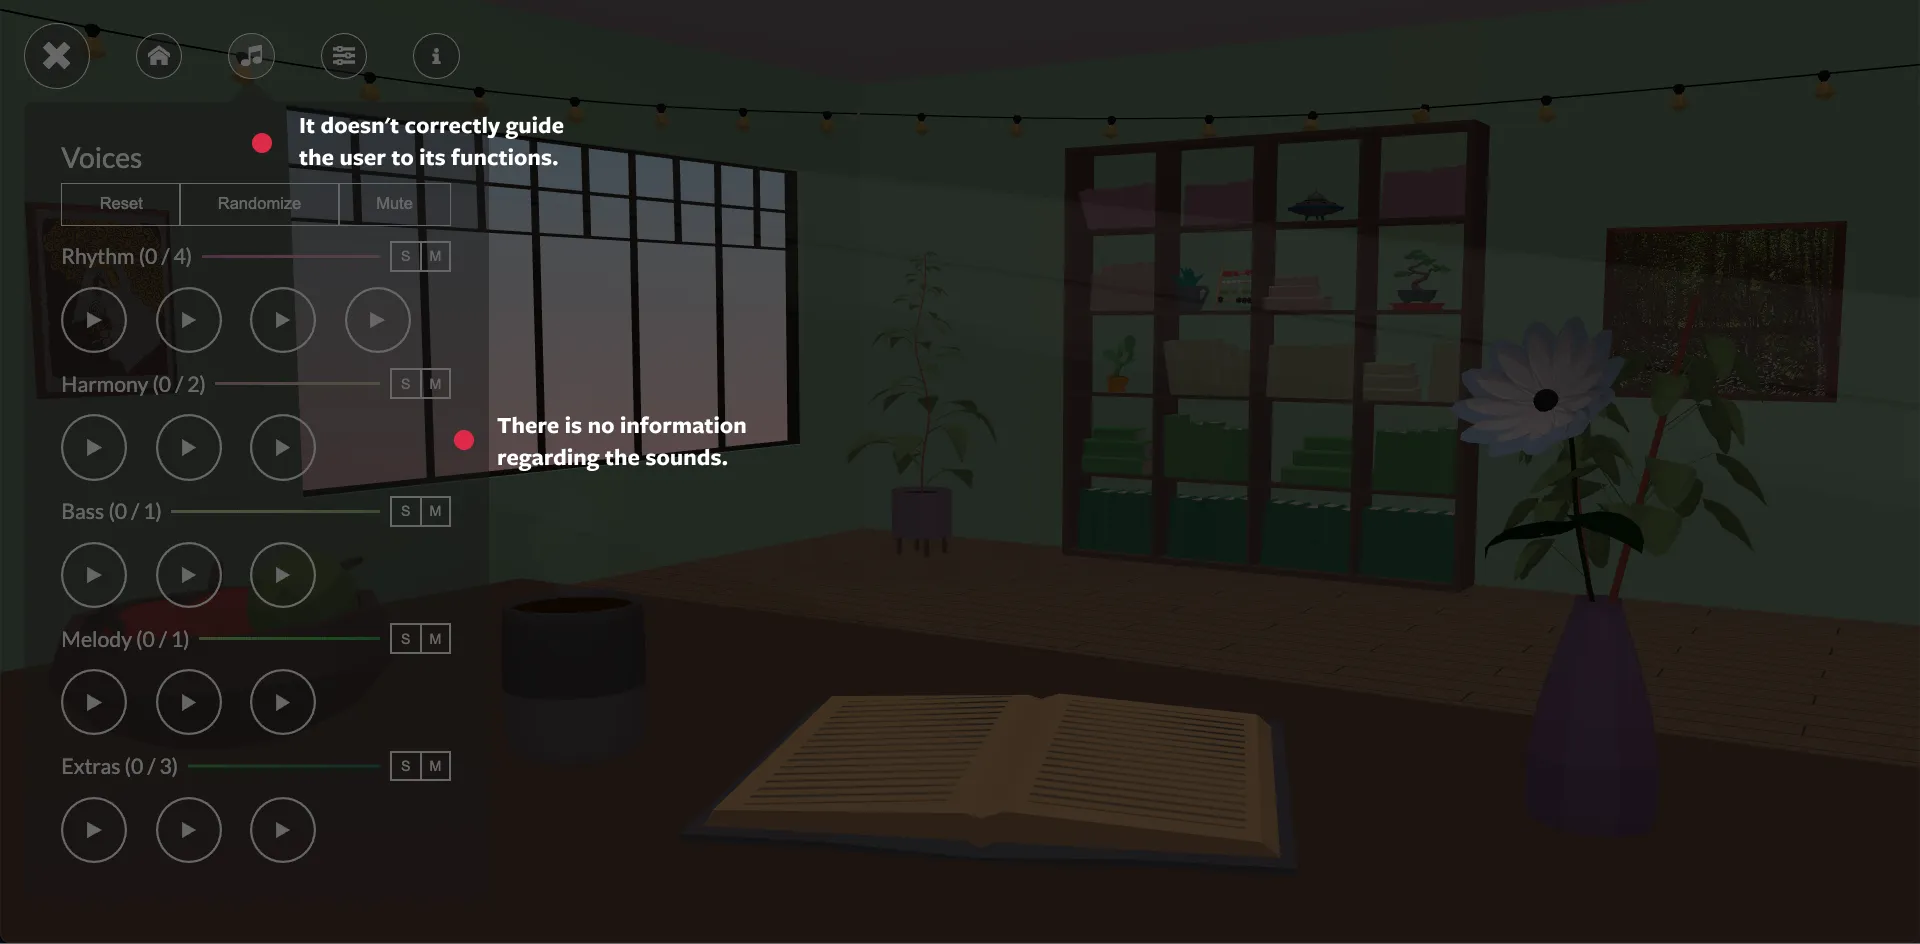
Give it a whirl, it’s completely interactive!
So what is the problem?
Pretty good question.
The project was based on an ongoing research project at the time, under Dr Priyankoo Sarmah, which studied the effects of socio-linguistic factors on vowel pattern variation across different dialects of Assamese. I was tasked to create a suitable interface for representing the data from a research project for anyone to access and interpret.
The research report
A gift from the Linguistics dept.
The original report from the research is now published and available over at ResearchGate.
I spent around a couple of weeks going through this report multiple times, understanding phonetics and how linguistics works. There were a few things that could be easily represented for the end-user.
Read more at ResearchGateAudio recordings
Over 600 speaker recordings across Assamese dialects needed to be made accessible and listenable, organised by district and region for meaningful comparison.
Dialect mapping
The research identified 10 distinct dialects across 3 regions of Assam. Representing their geographic distribution required an intuitive, map-based interface.
Level of pride data
Speakers were surveyed about their pride in their language and dialect. This sentiment data needed to be visualised alongside geographic and demographic context.
Lexical variations
Assamese has rich synonymic variation across regions. The research catalogued how the same words are used differently, requiring a way to compare usage patterns across the state.
A look into Soundscapes
One of the best ways to represent audio.
A term first coined by the Canadian composer R. Murray Schafer, a soundscape is a sonic landscape. It is the total acoustic values related to a specific place. Soundscapes can be understood only through peoples’ perceptions. Information can easily be interpreted when we create an abstraction with the sounds from the soundscape. Data is inherently difficult for the human brain to understand and retain. Most adults can store between 5 and 9 items in their short-term memory.
I also spent time on the basics of data visualisation, because at the core, a soundscape is an auditory depiction of data.
Existing soundscape designs
Something like a Competitor analysis.
I came across 2 soundscapes which had good interactions and depicted auditory information in a creative design.
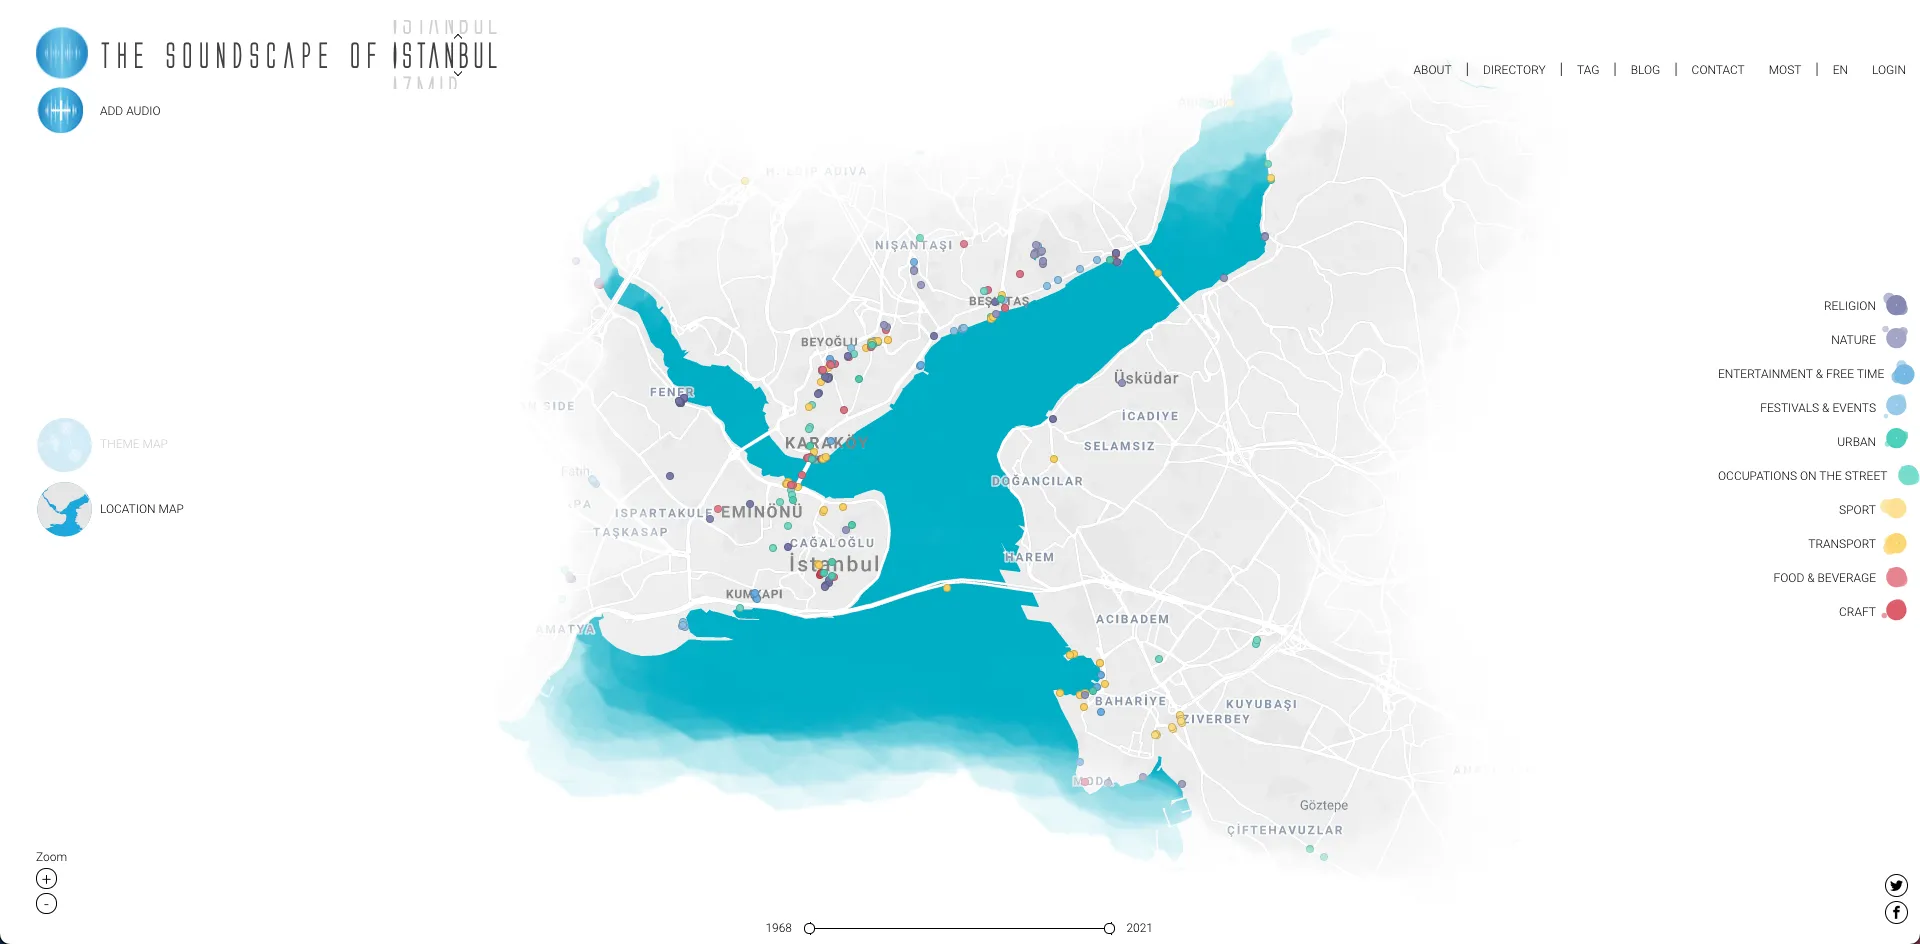
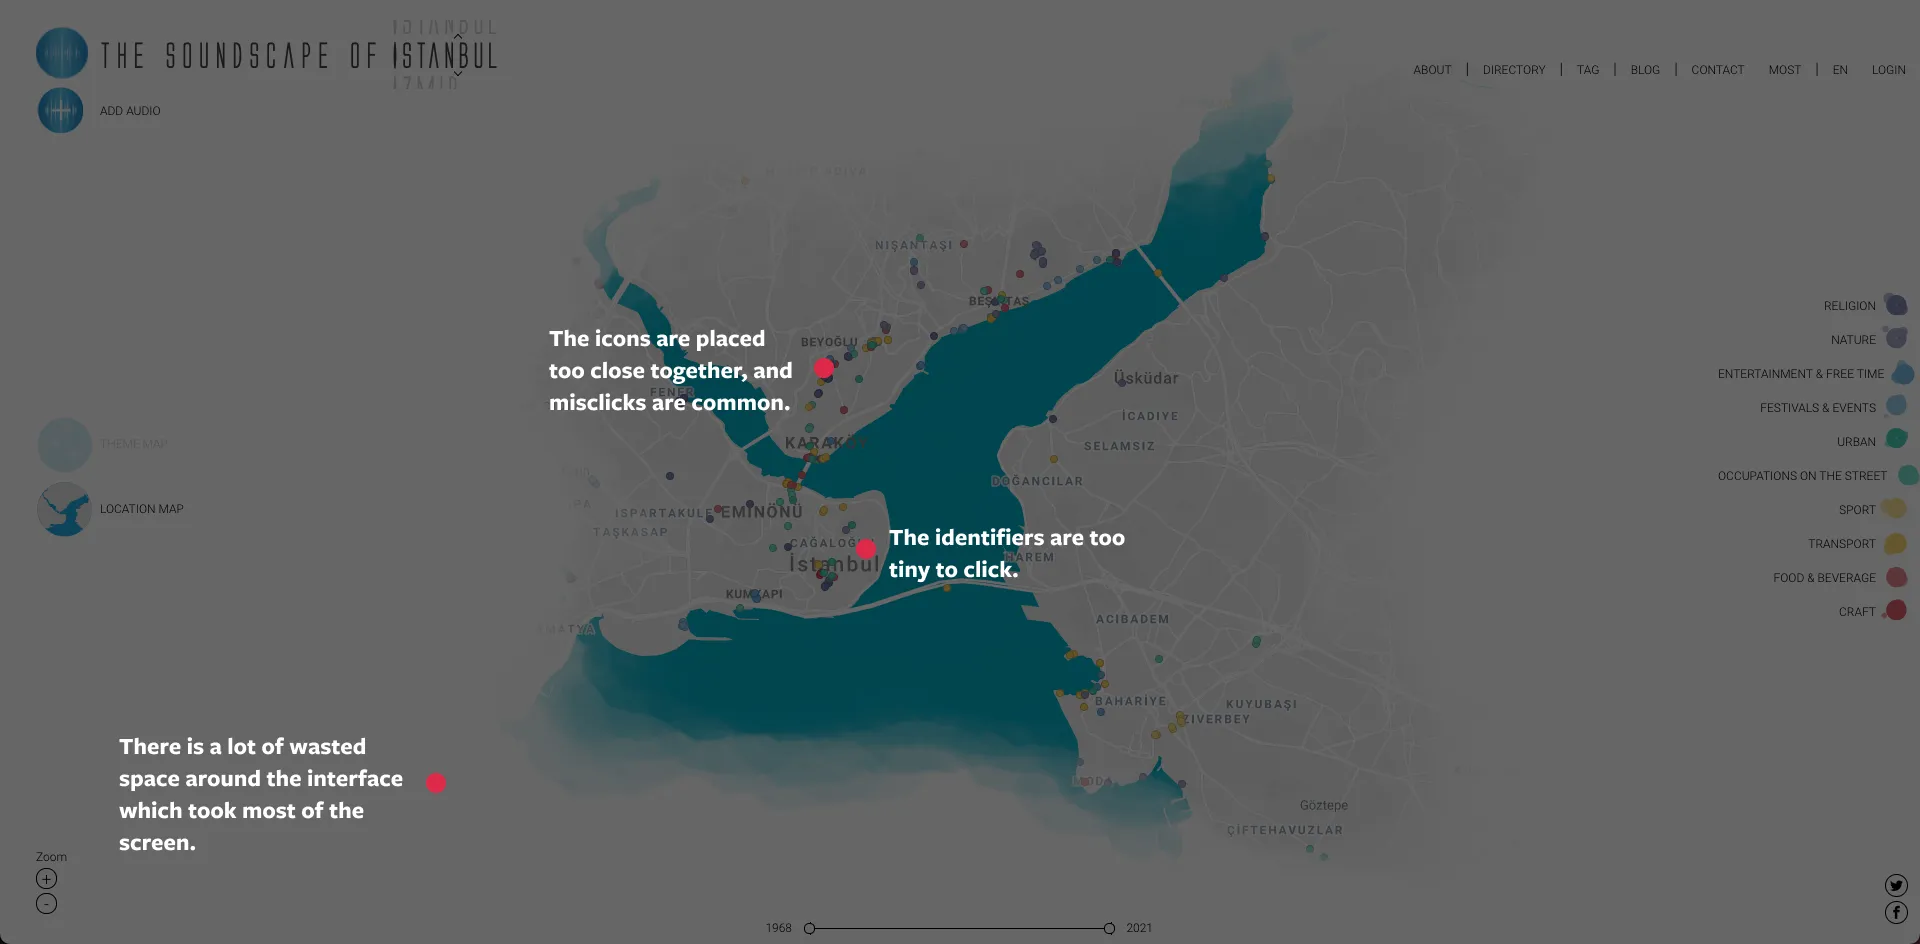
1. Soundsslike Project
Soundsslike used small dots as identifiers for sounds. On click, it plays the audio along with details about the place.
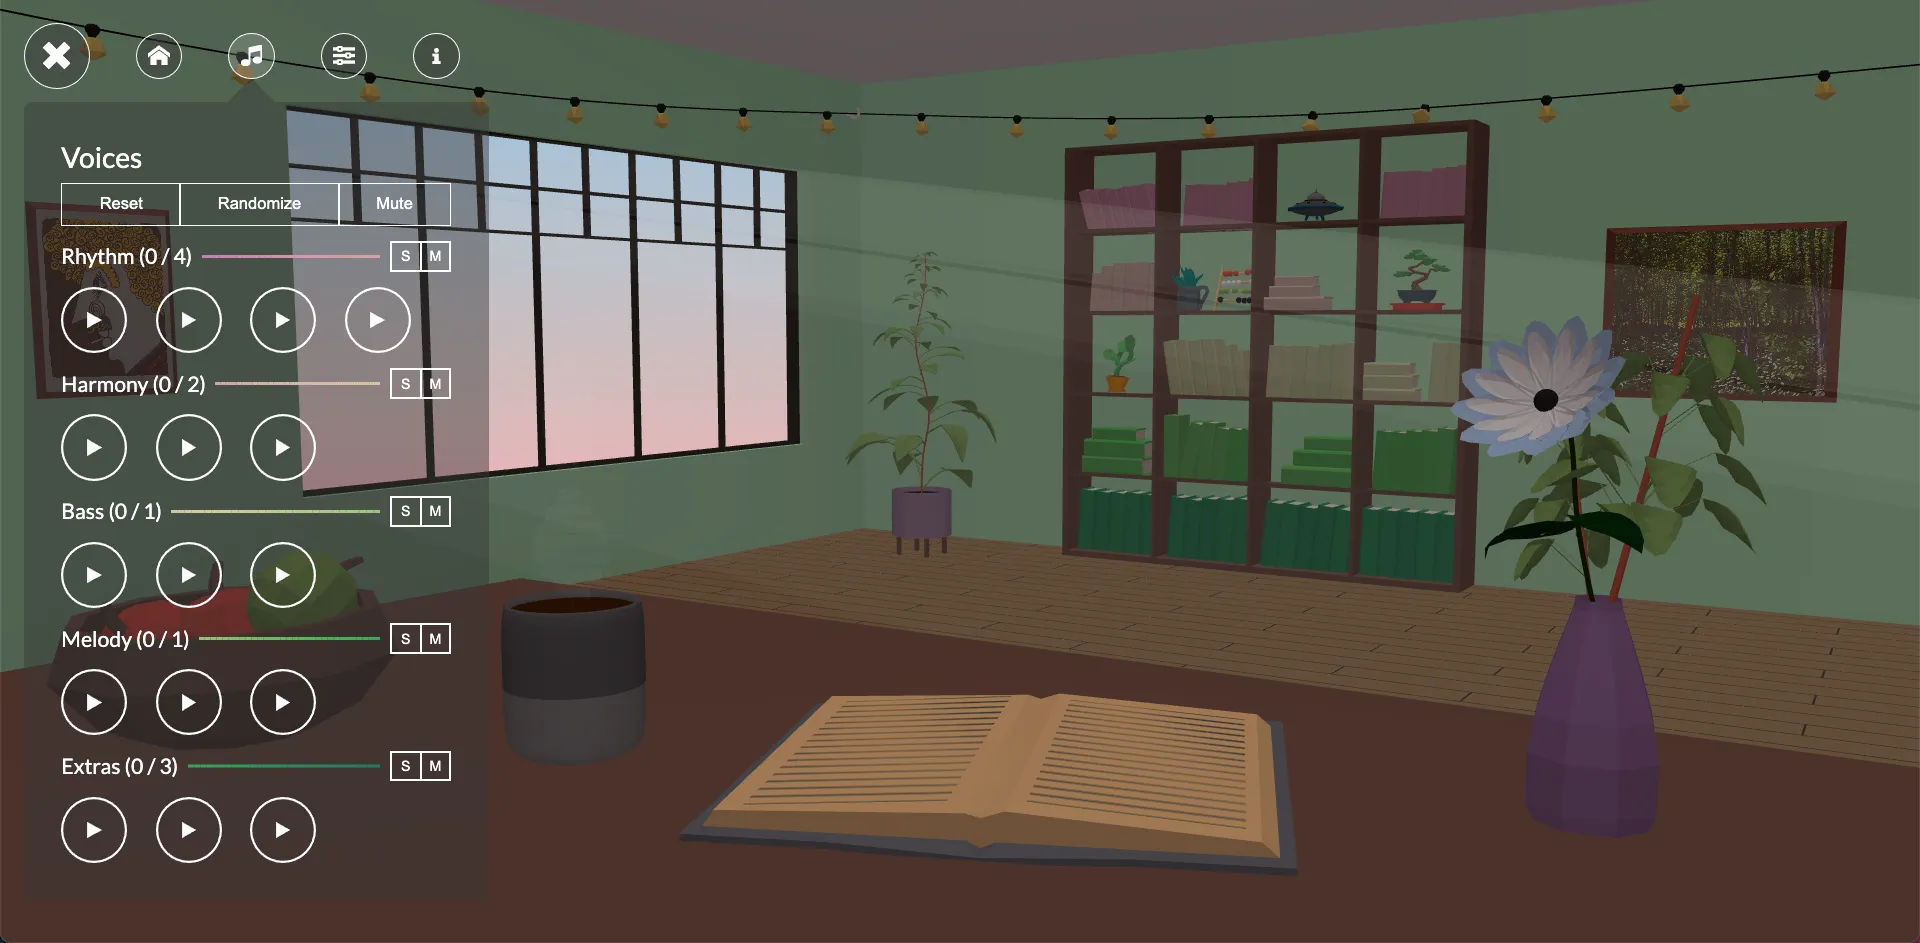
2. Soundscape World
They had a different approach. It consists of a player with multiple buttons and a lot more control of the audio. These were categorised into the nature of the sound. This design was completely different from Soundsslike.
The concept
Starting from the drawing board, literally.
I decided to divide the design into three sections. These had different colours, indicating the data is different from one another. I started with some concept sketches.
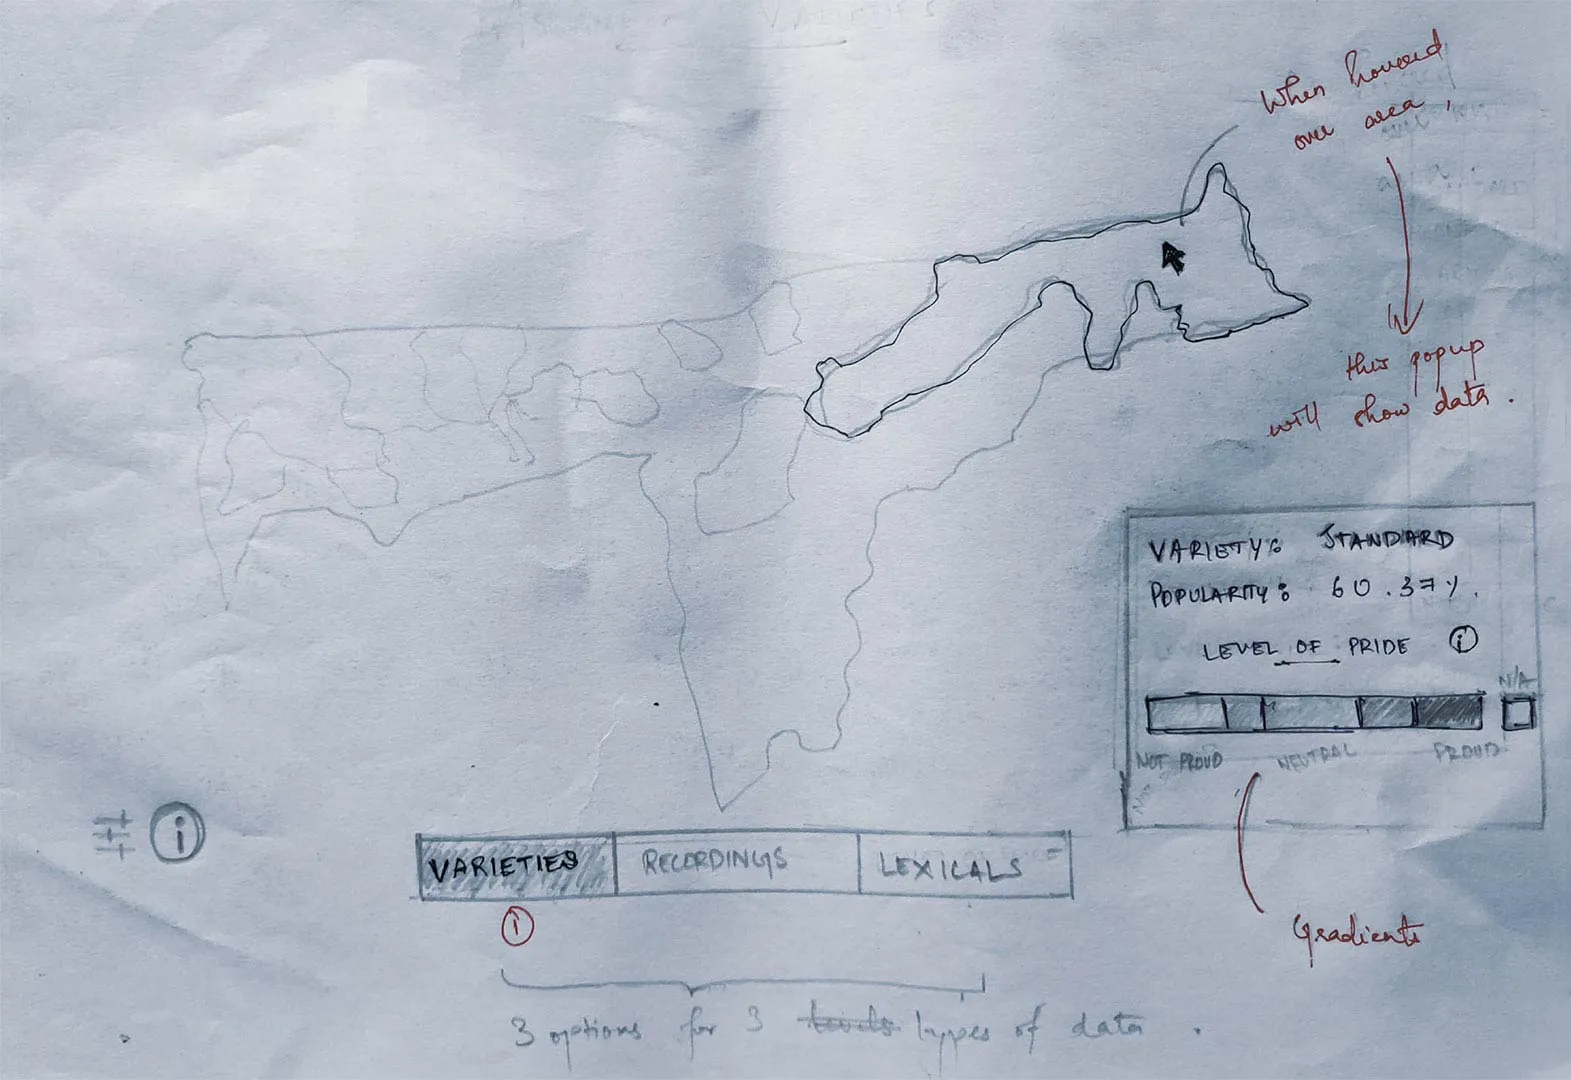
1. Dialects tab
A map-based view showing the geographic distribution of 10 Assamese dialects across Western, Central, and Eastern Assam.
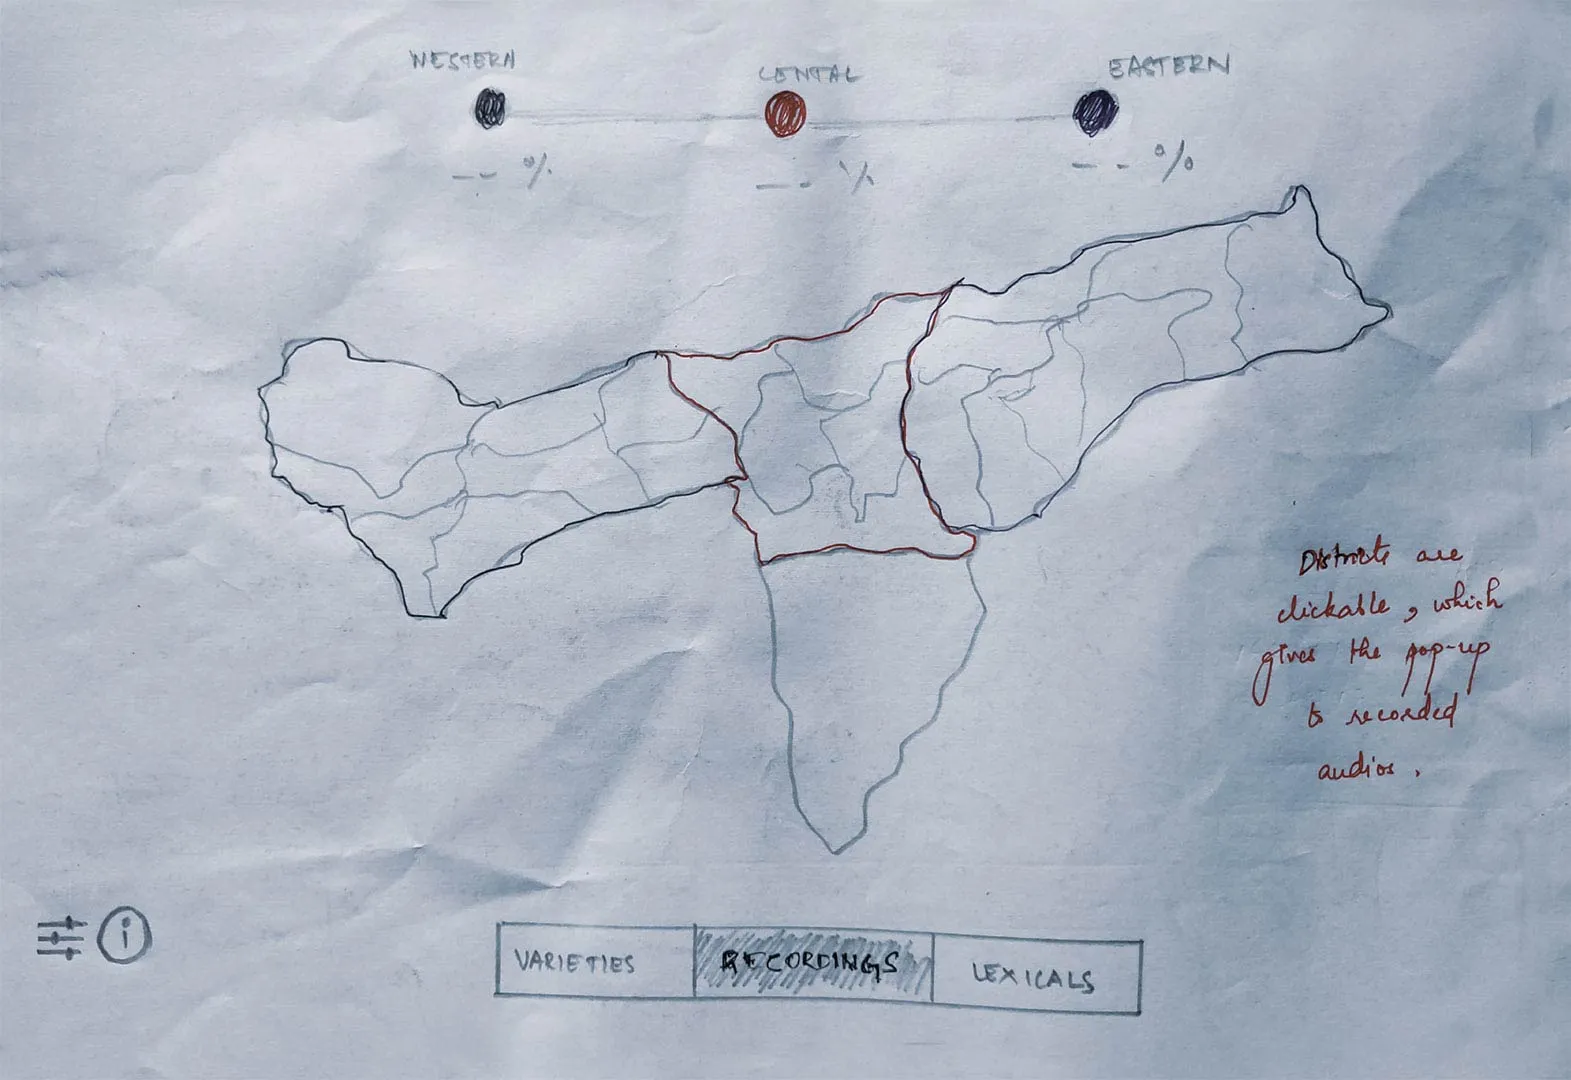
2. Listen tab
An interactive map where users can click on districts to listen to dialect recordings from that region.
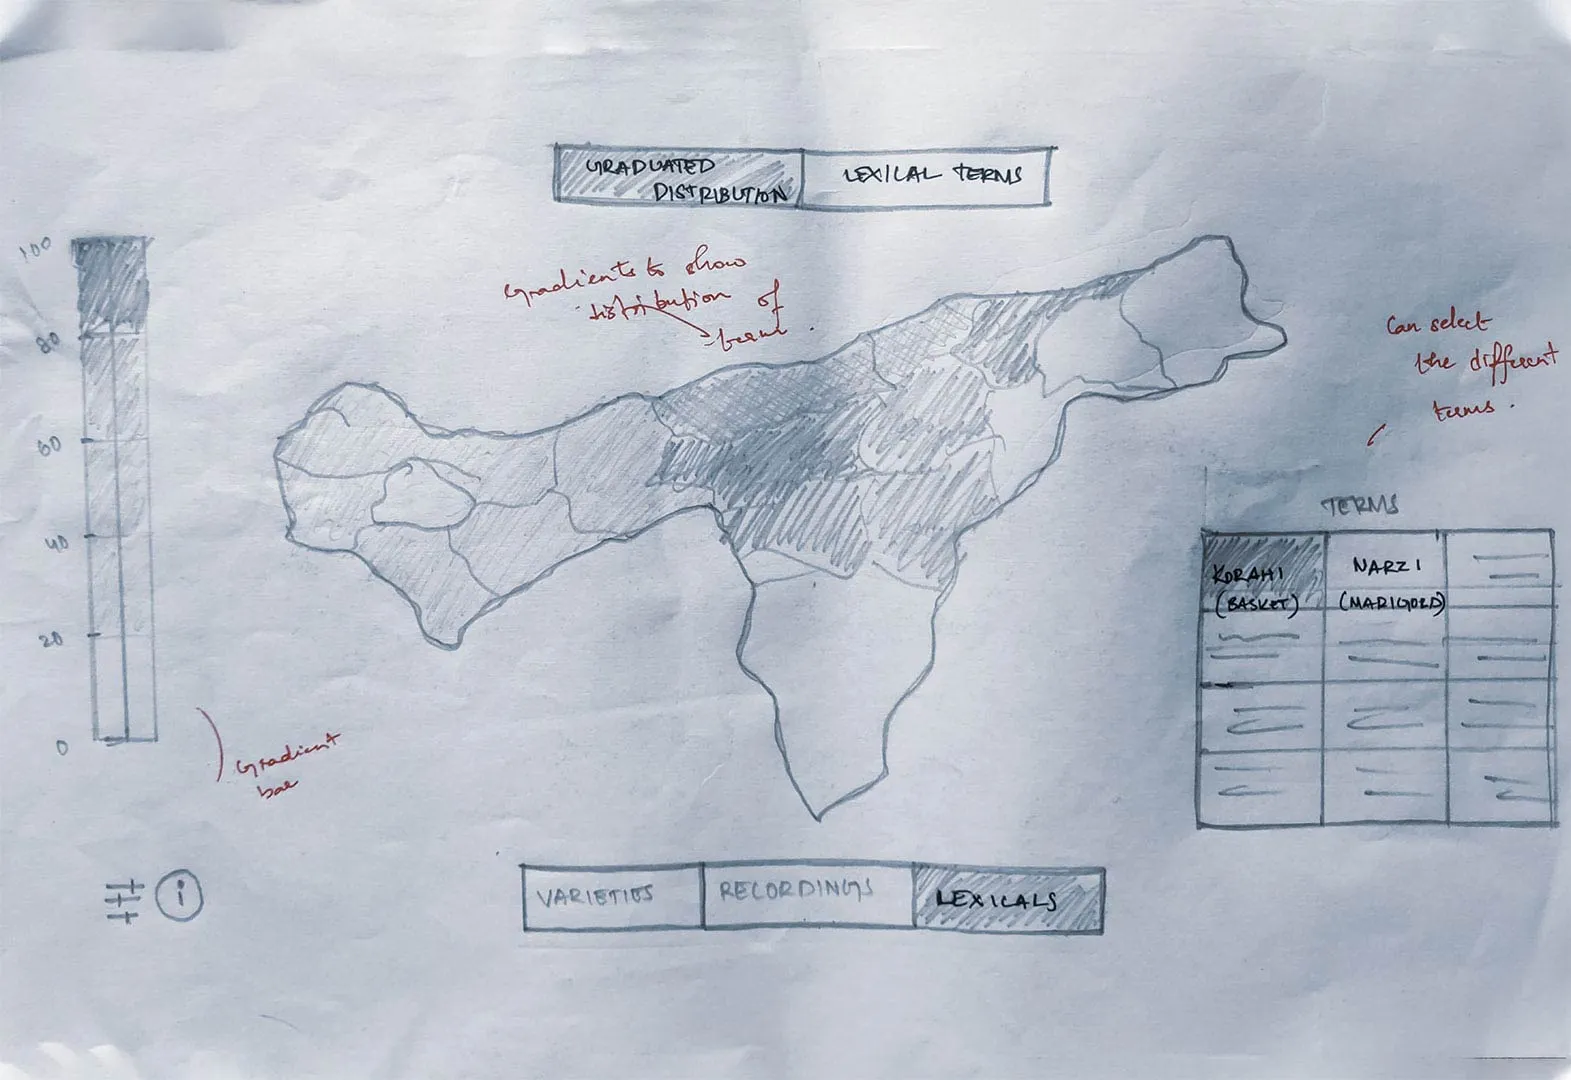
3. Words tab
A visualisation of lexical variation, showing how different words are used across districts and dialects.
The Development
WebD? Seriously?
I built it with HTML5 for the structure and Bootstrap 4 for responsive layouts. JavaScript handled the dynamic bits, with jQuery for interactivity and DOM work. It’s hosted on GitHub Pages, which is simple and ties straight into version control. For a first proper build, that setup kept development and deployment painless.
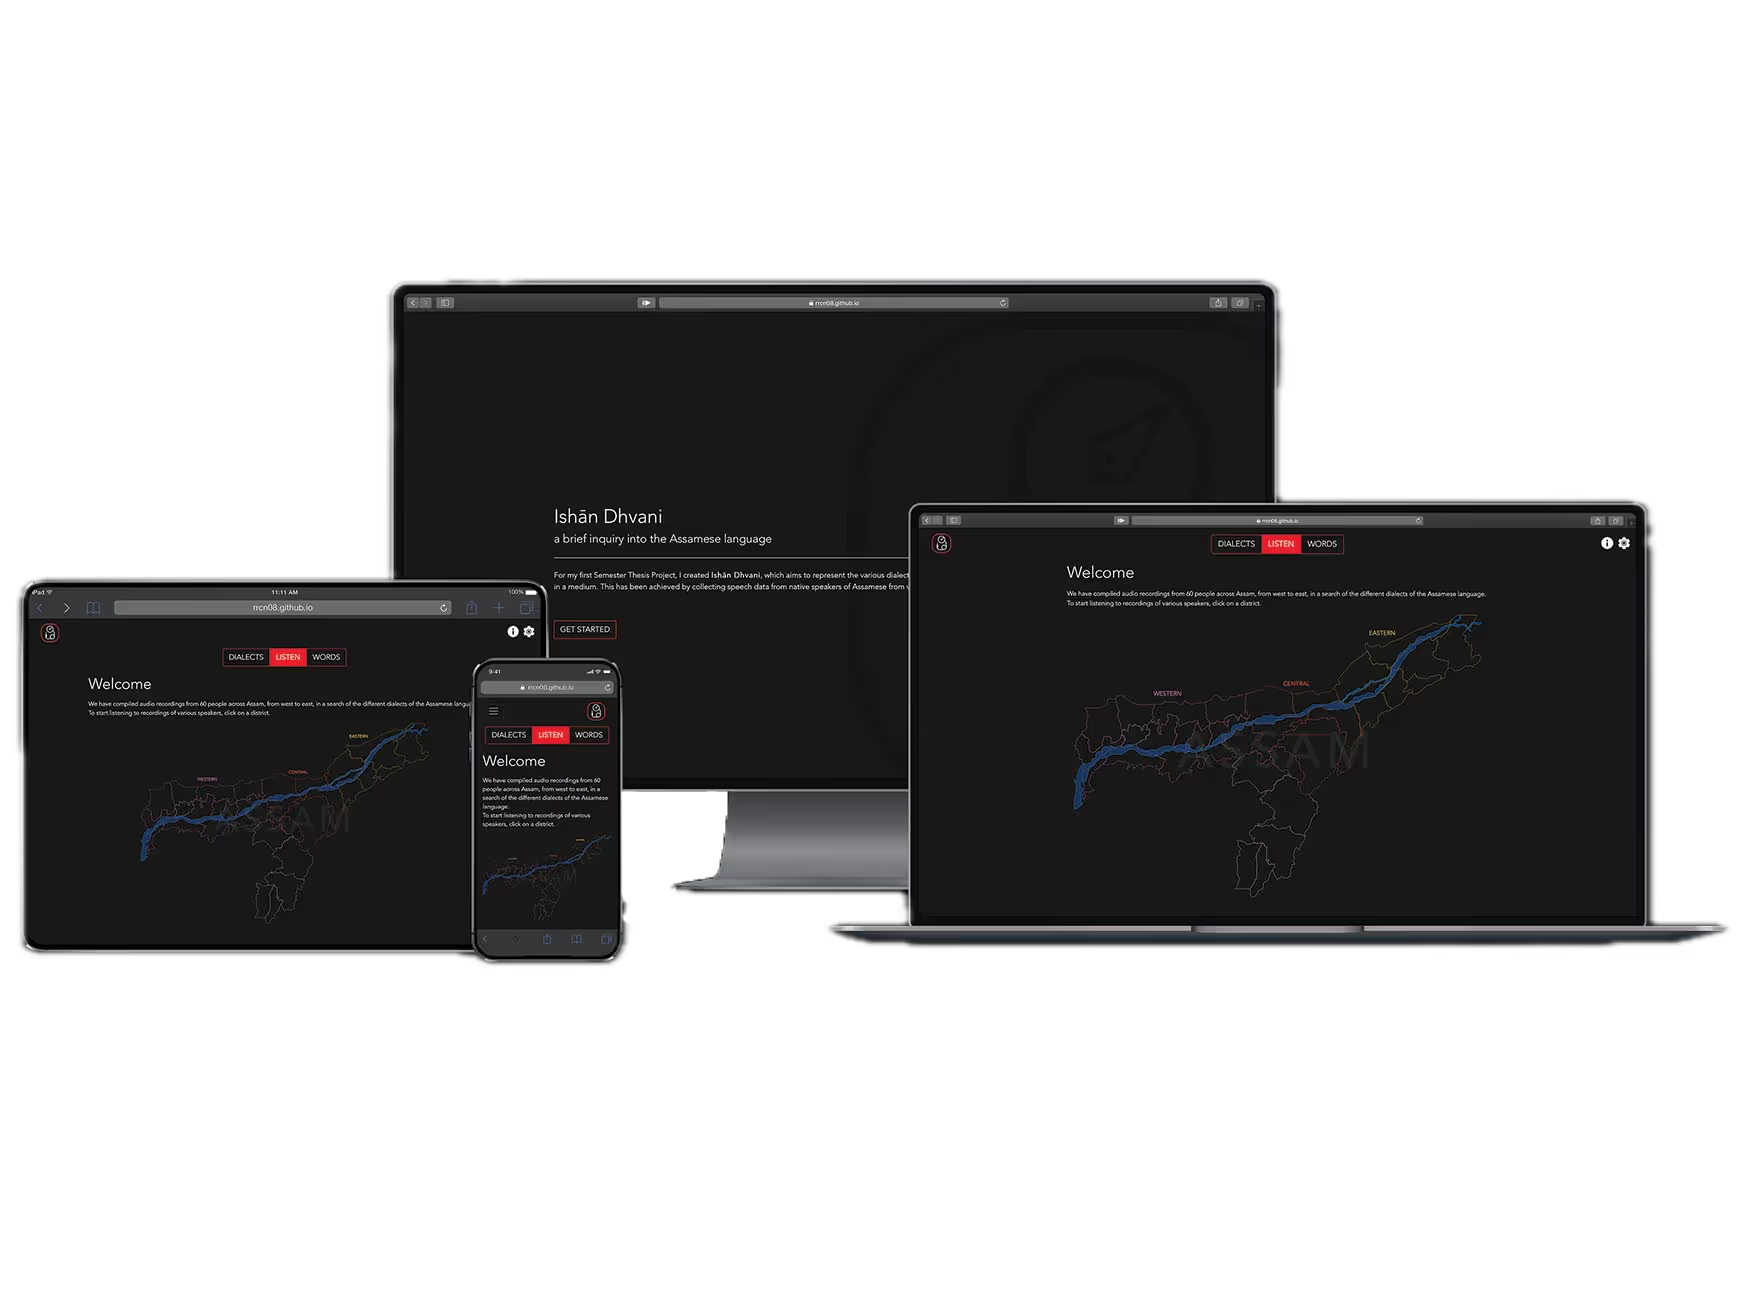
The final designs
What got built out finally.
Learning to code and develop this in the 4 month time-frame, besides dealing with the aftermath of a lockdown was something of a rollercoaster indeed.
Listen page
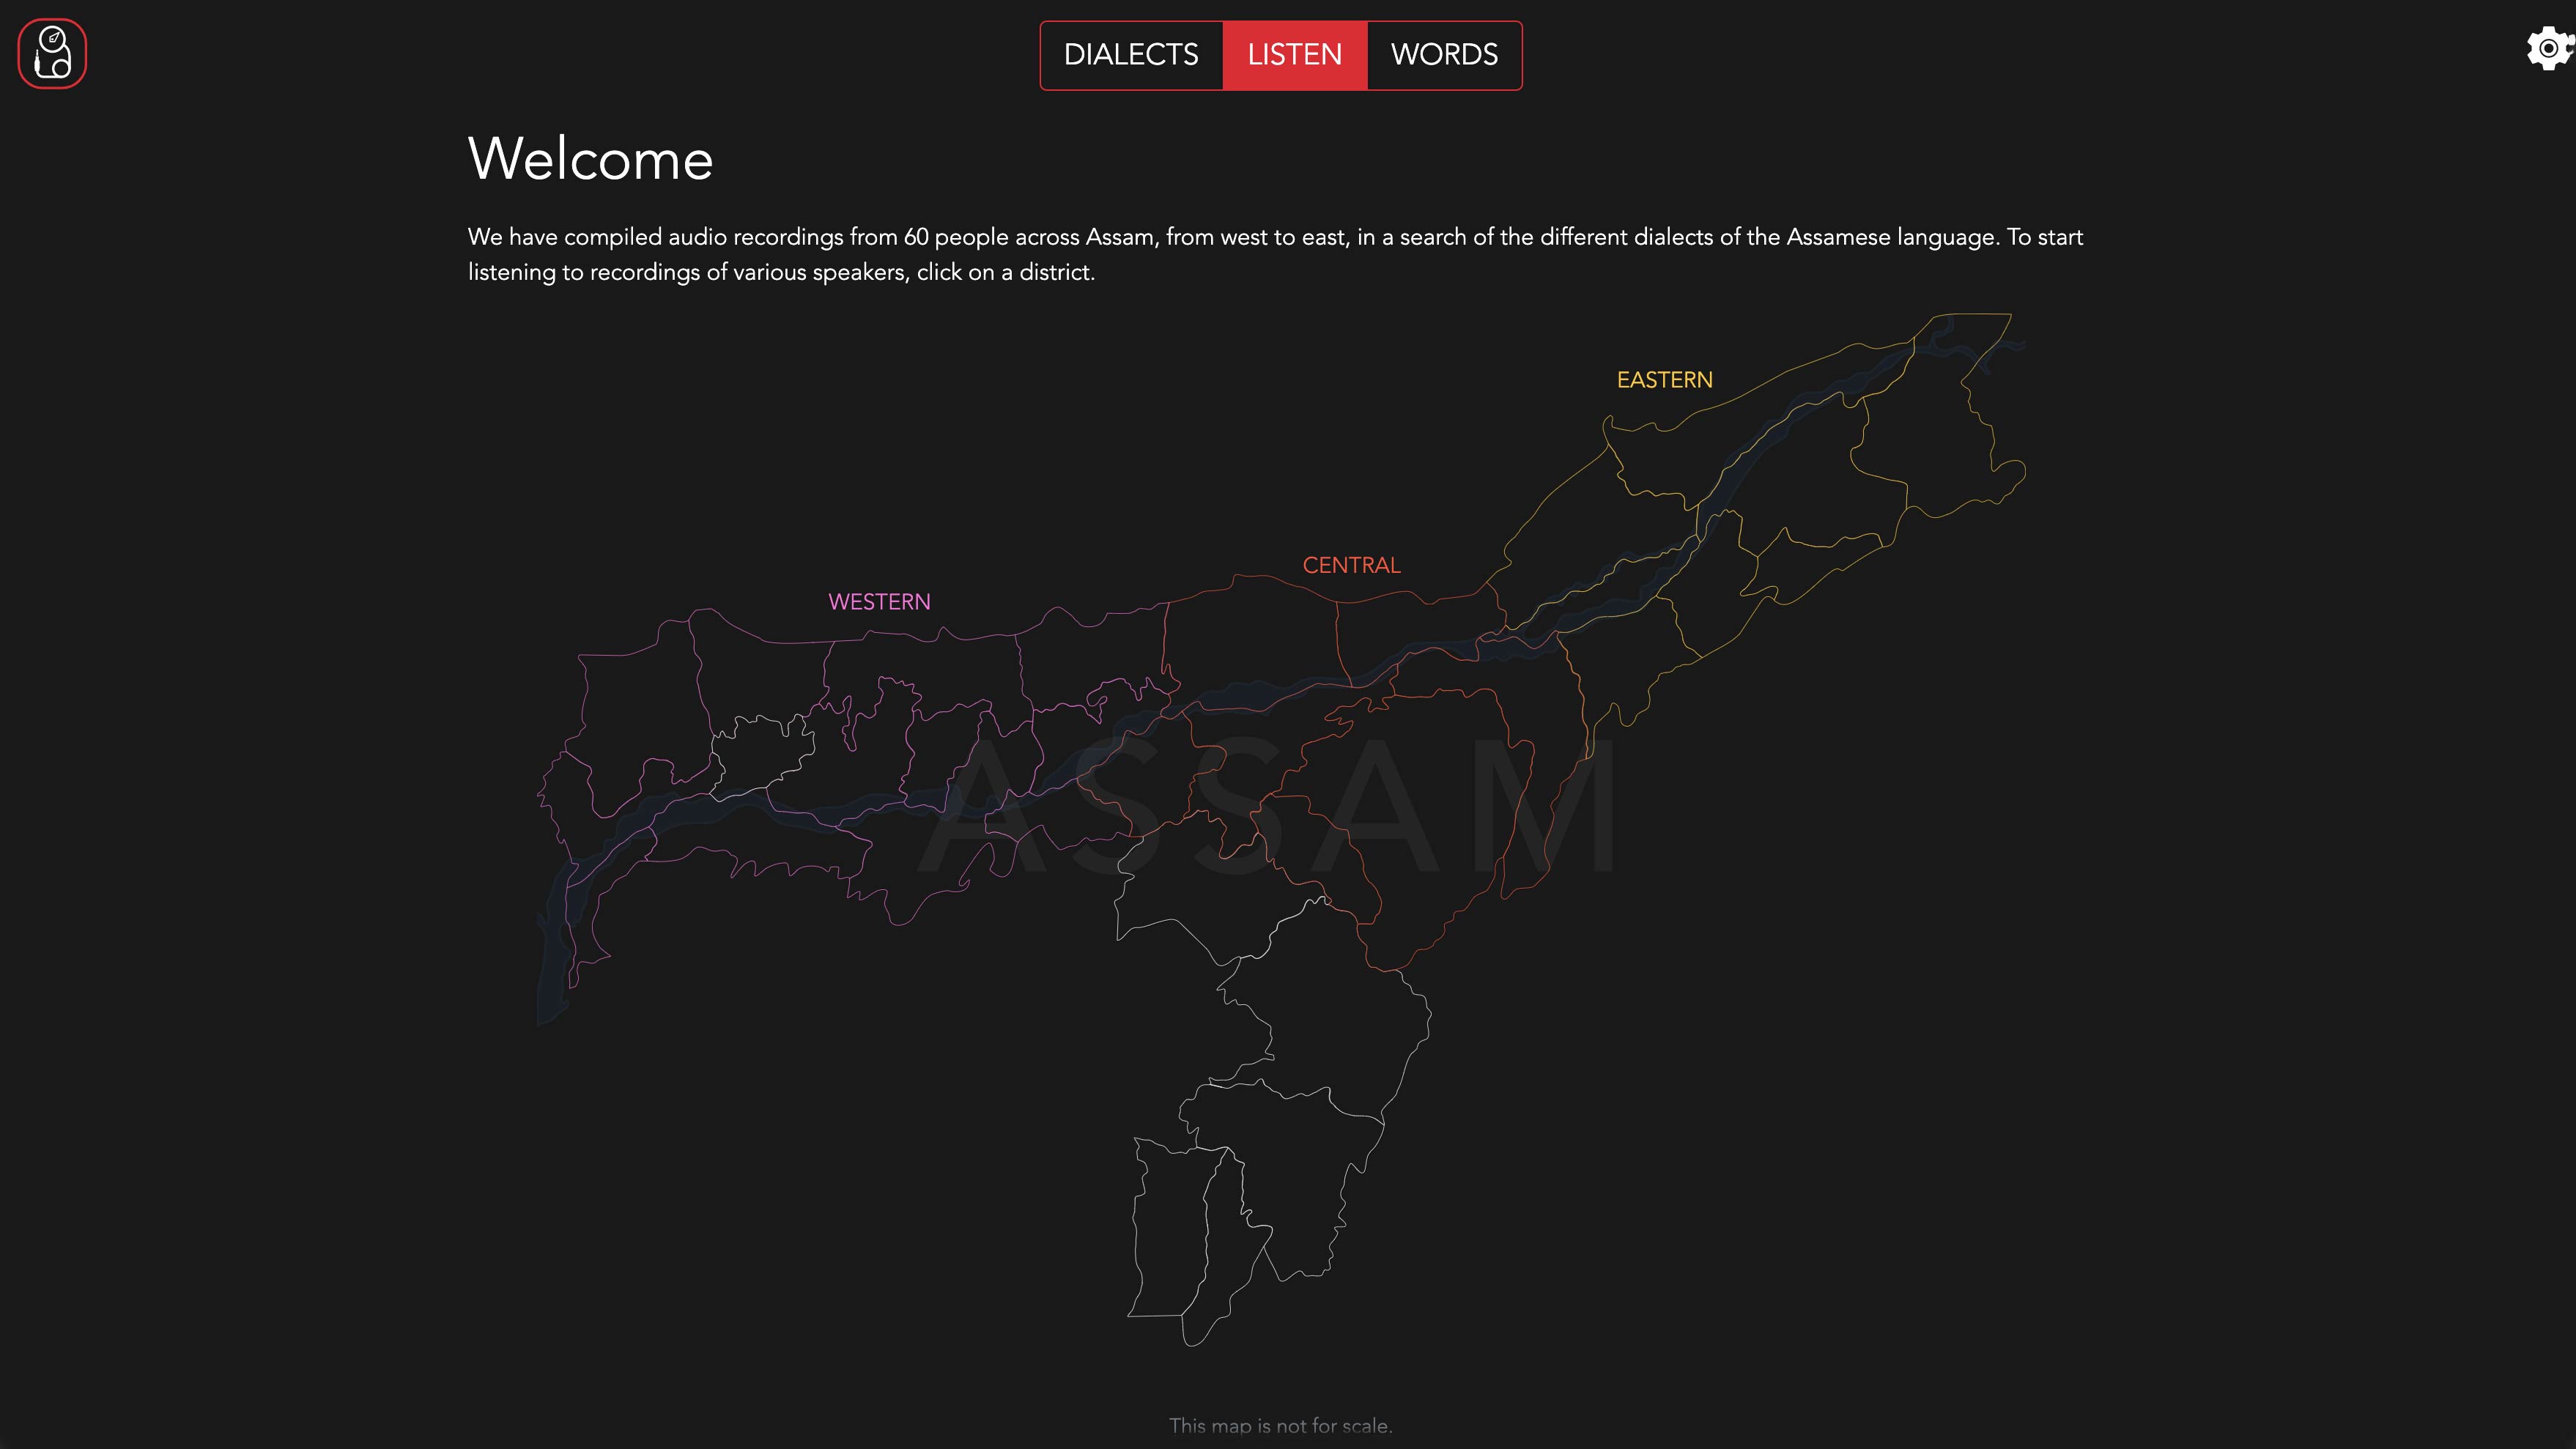
The Listen page has the entire map of Assam, where one can click on each district to listen to the dialects of that region. The map is divided into 3 regions, Western, Central, and Eastern Assam. These regions are colour-coded for easy identification. There's also the Brahmaputra river flowing through the map, which is a significant landmark in Assam. Some regions are not clickable, as these are not part of the Assamese-speaking regions.
District pop-up
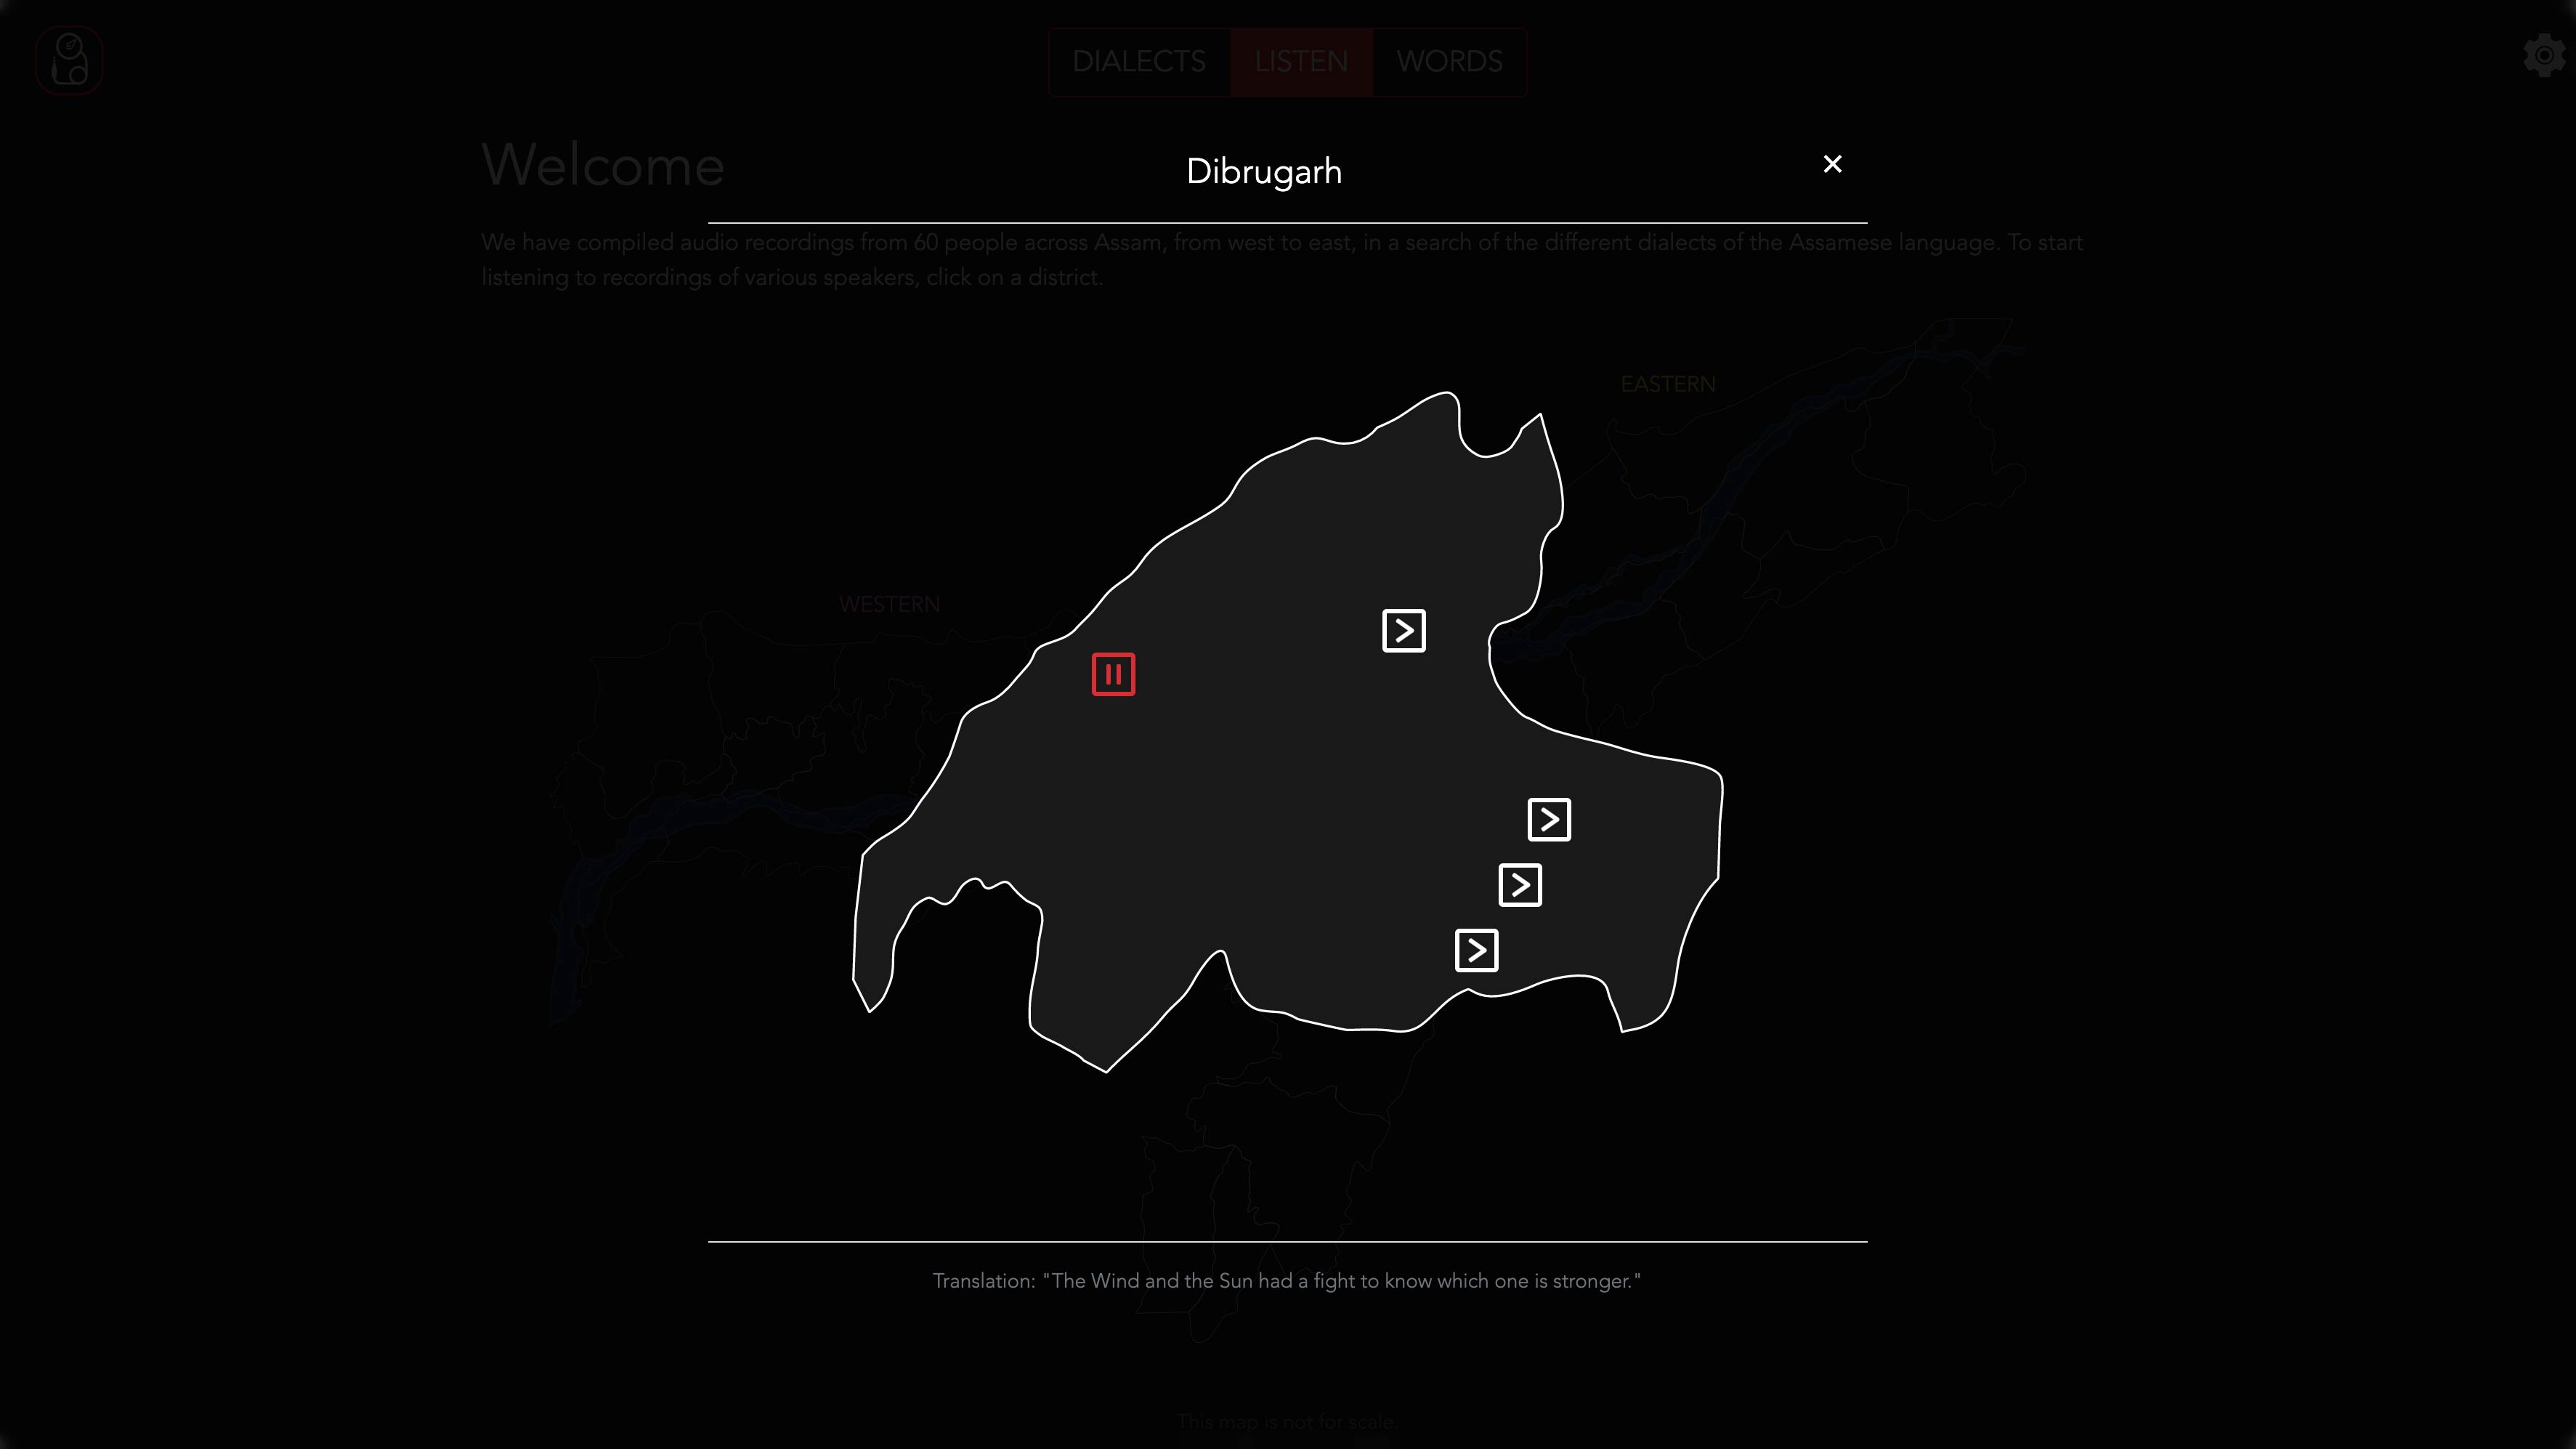
Upon clicking on a district, a modal opens up, which has the dialect recordings of that district. The user can click on the play button to listen to the dialect. There's also a small passage below, which is the translation of the recording.
Dialects map
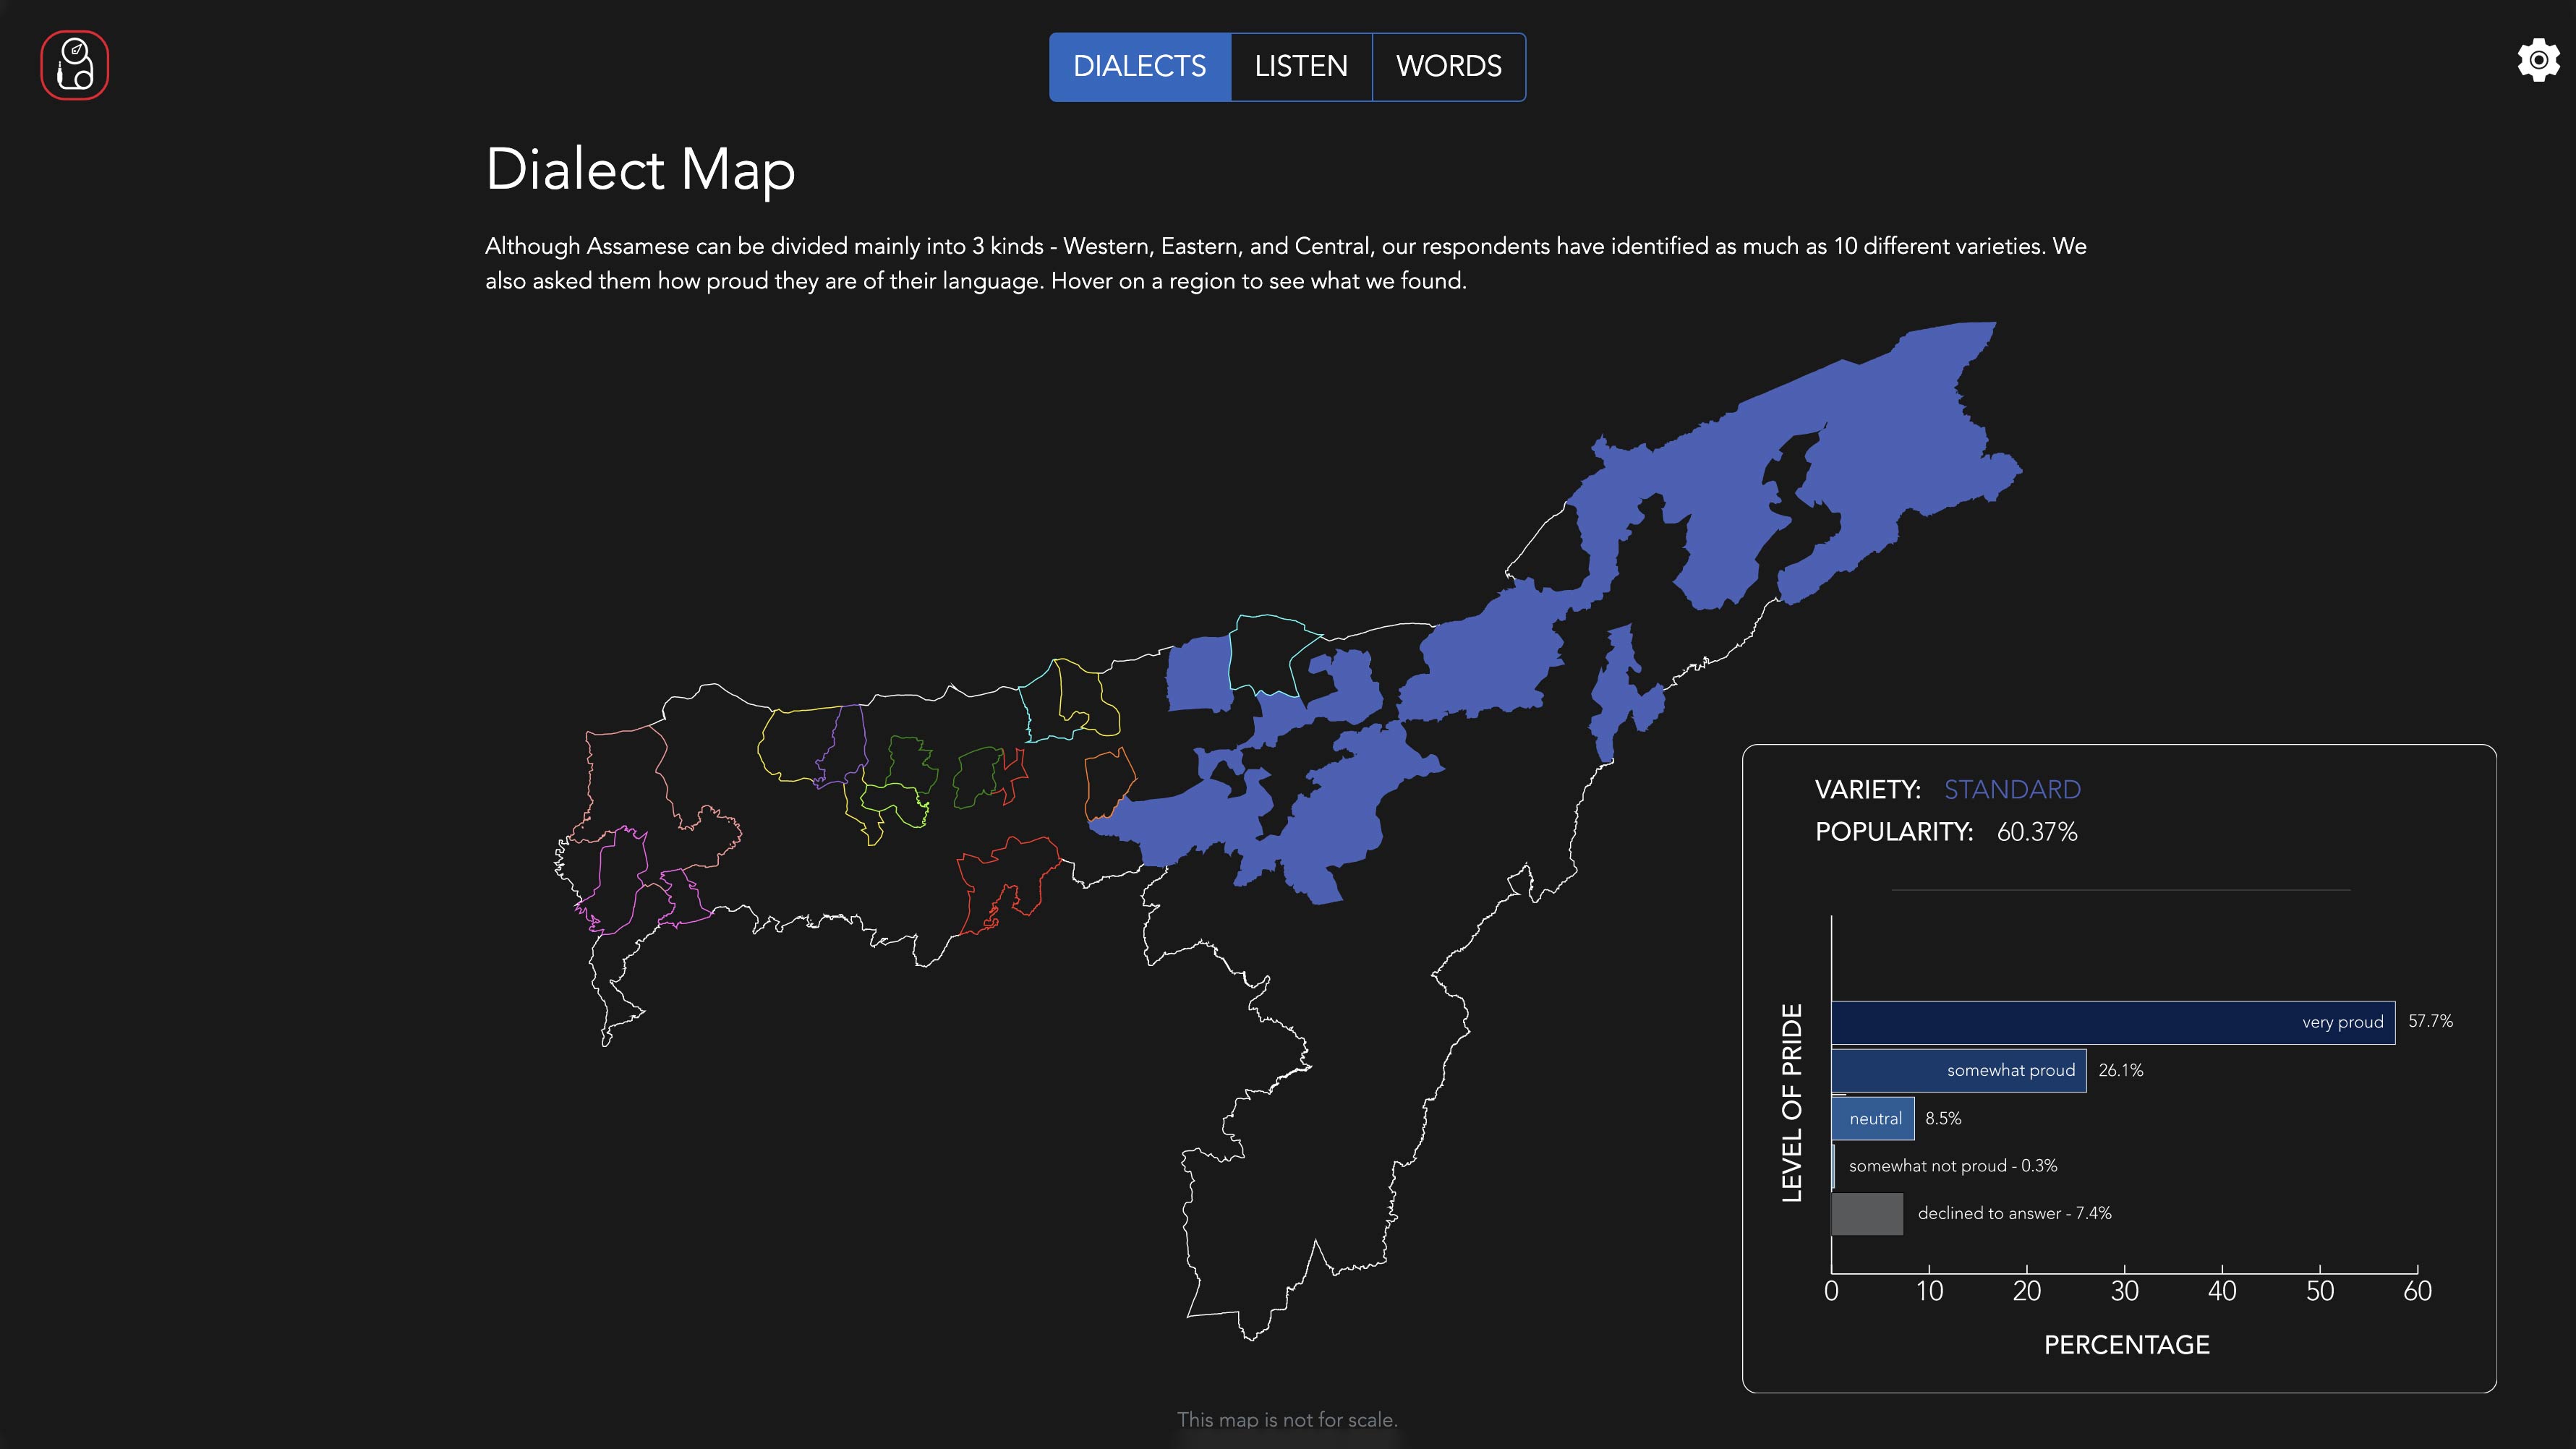
While the state is divided into 3 regions, the research picked up as much as 10 different dialects. Each person who was recorded was asked how proud they were of their language. This was then represented in the map as a bar chart. One can hover over each region to see the statistics.
Word distribution
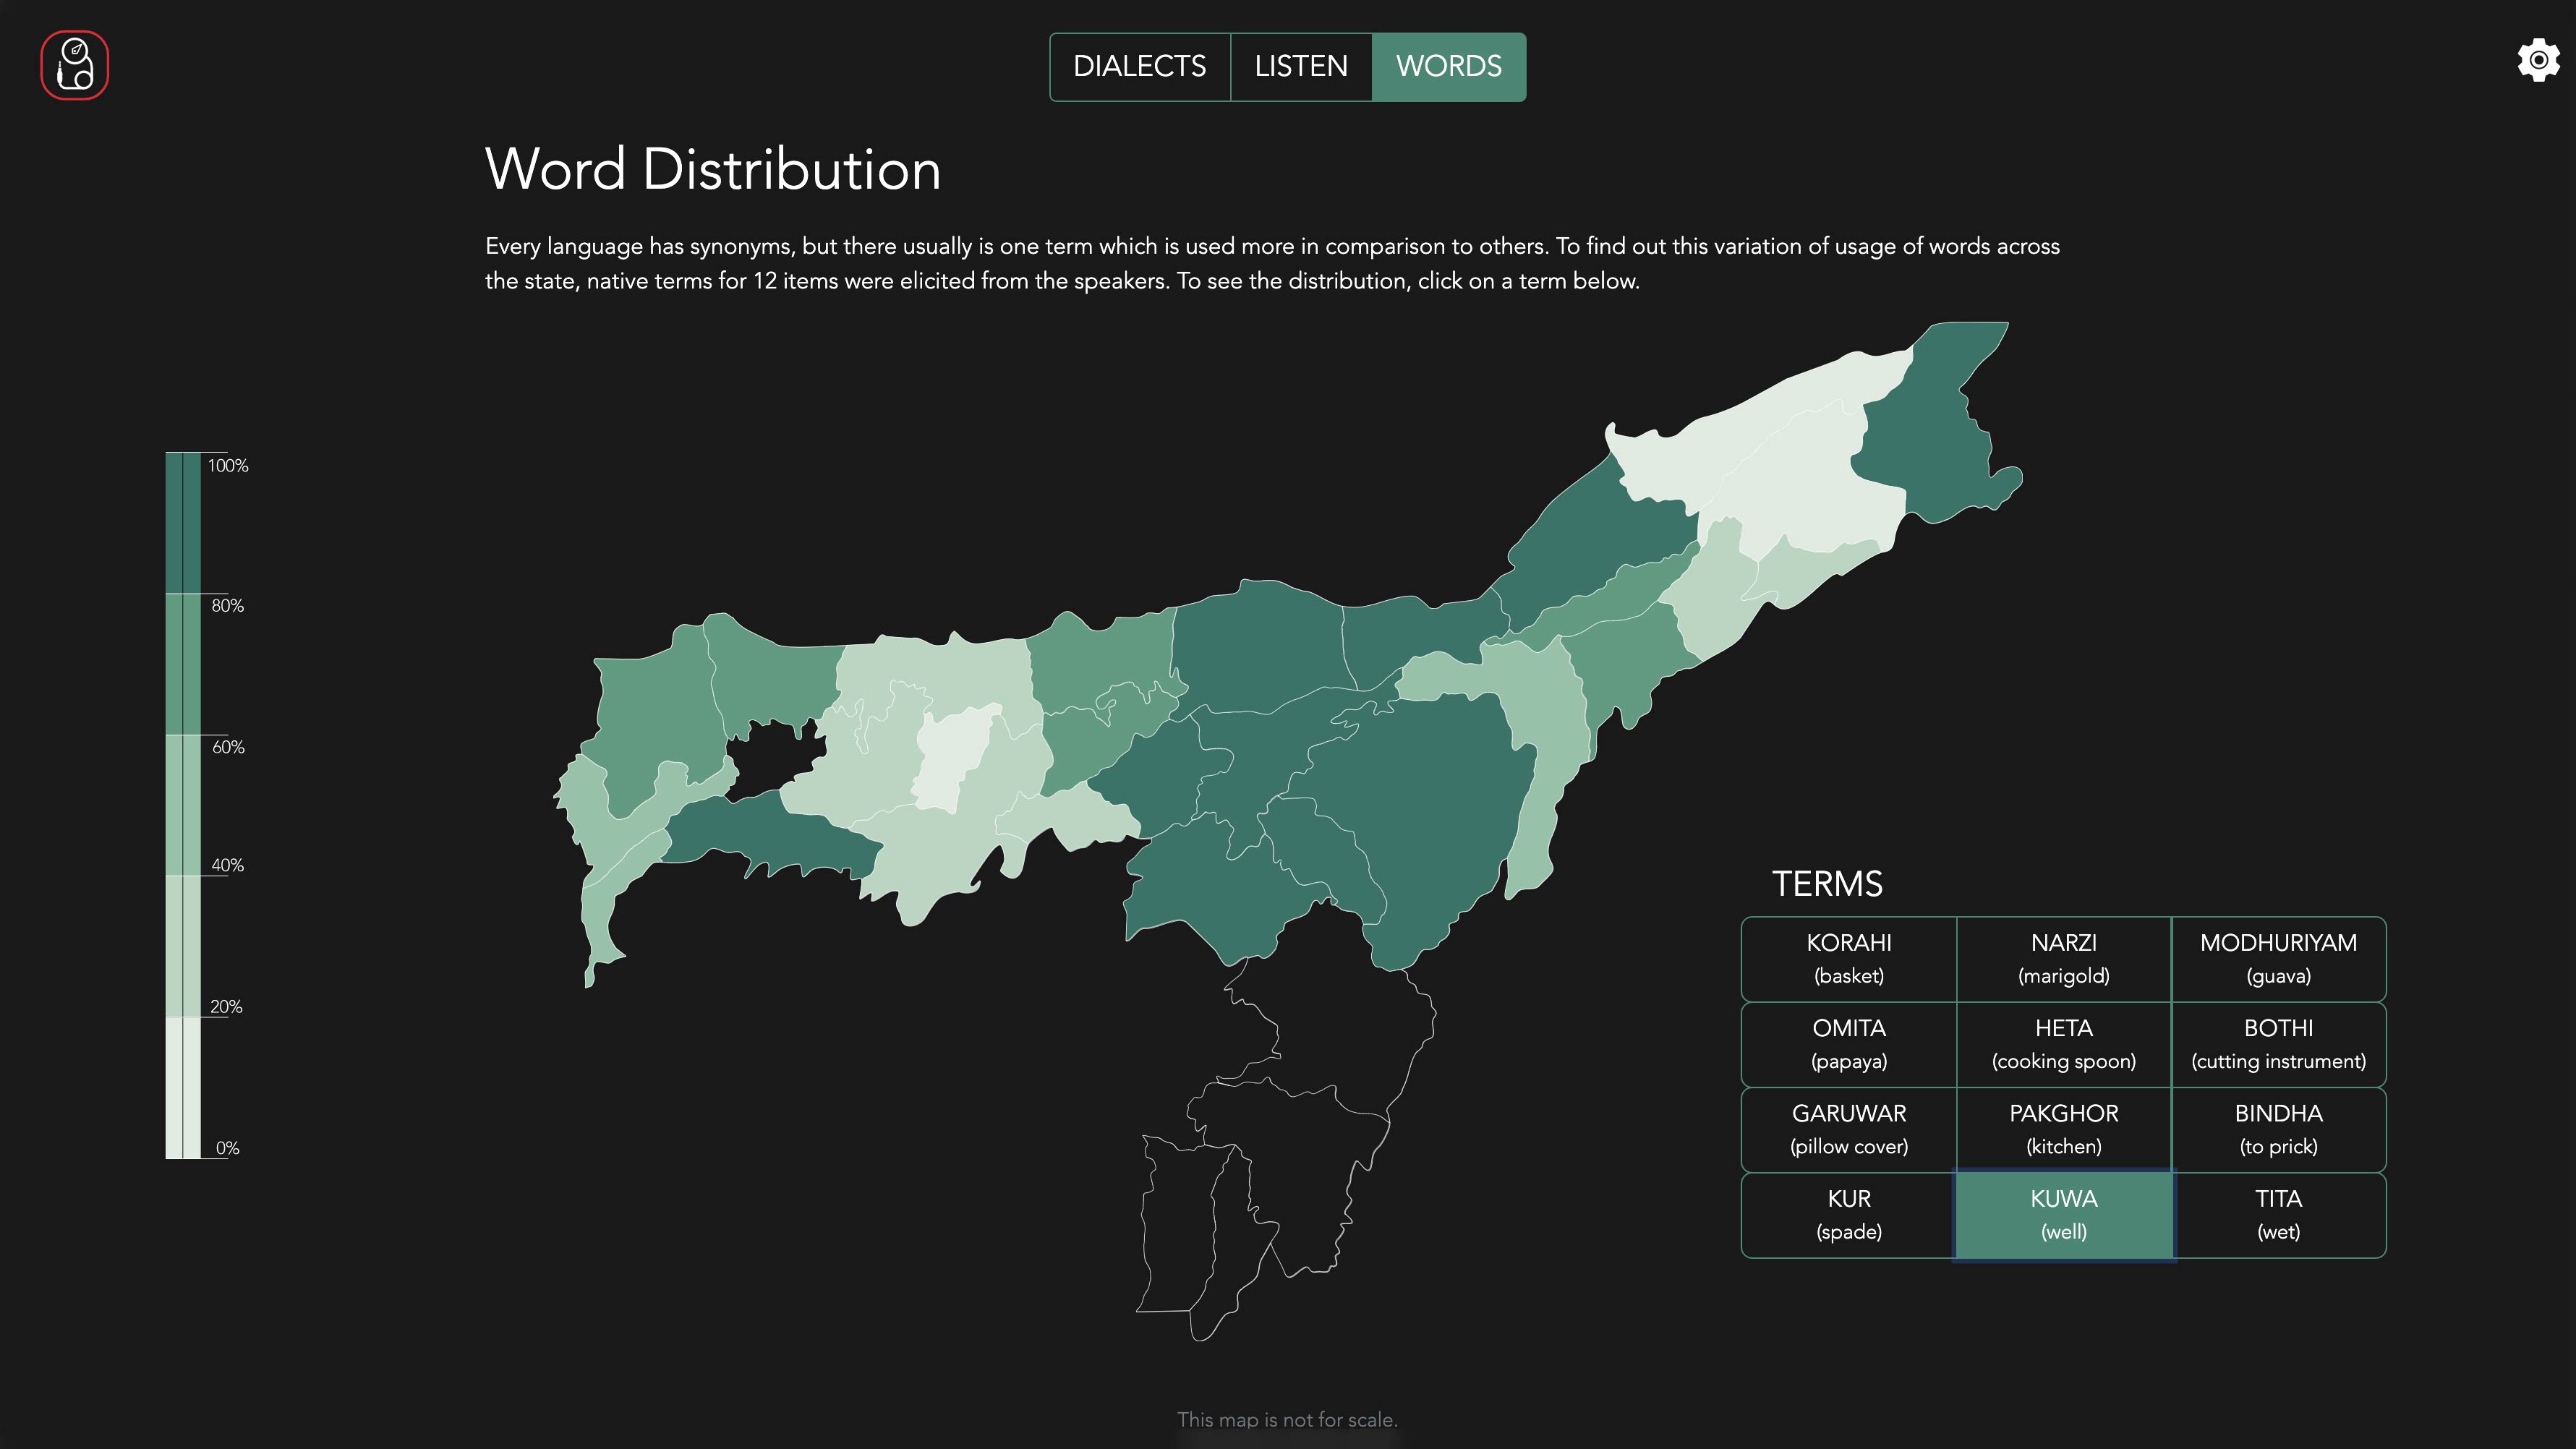
Like every language, Assamese also has a lot of synonyms. This page shows the variation of usage of these words across the state. The user can click on any word to see this.
Some final thoughts
And maybe some of my learnings
This project is what got me into web development, and it pushed me to build my own website from scratch afterwards. Looking back, there’s plenty I’d change: the calls to action are limited, so there isn’t much for users to do; you can’t upload your own audio, which rules out any crowd-sourced data; and the recordings are short and a bit repetitive. With more time, I’d add a way for people to record their own speech, both to make it more interactive and to gather audio for comparison.