Designing data partitions for Viva Insights
The short version.
As Microsoft migrated Viva Insights off Workplace Analytics, enterprises needed a way to give each analyst access to only the people-data they're permitted to see. That privacy-critical, admin-facing capability is called Partitions.
I owned the design of the Partitions experience end to end: the research, the SUS-tested creation wizard, the partition switcher, and the privacy-settings onboarding. I partnered with PM and engineering through to GA.
Partitions shipped to GA in January 2024 and is now active across 70+ enterprise tenants and 1.5M+ licences.
Understanding the existing platform
First, how it worked before.
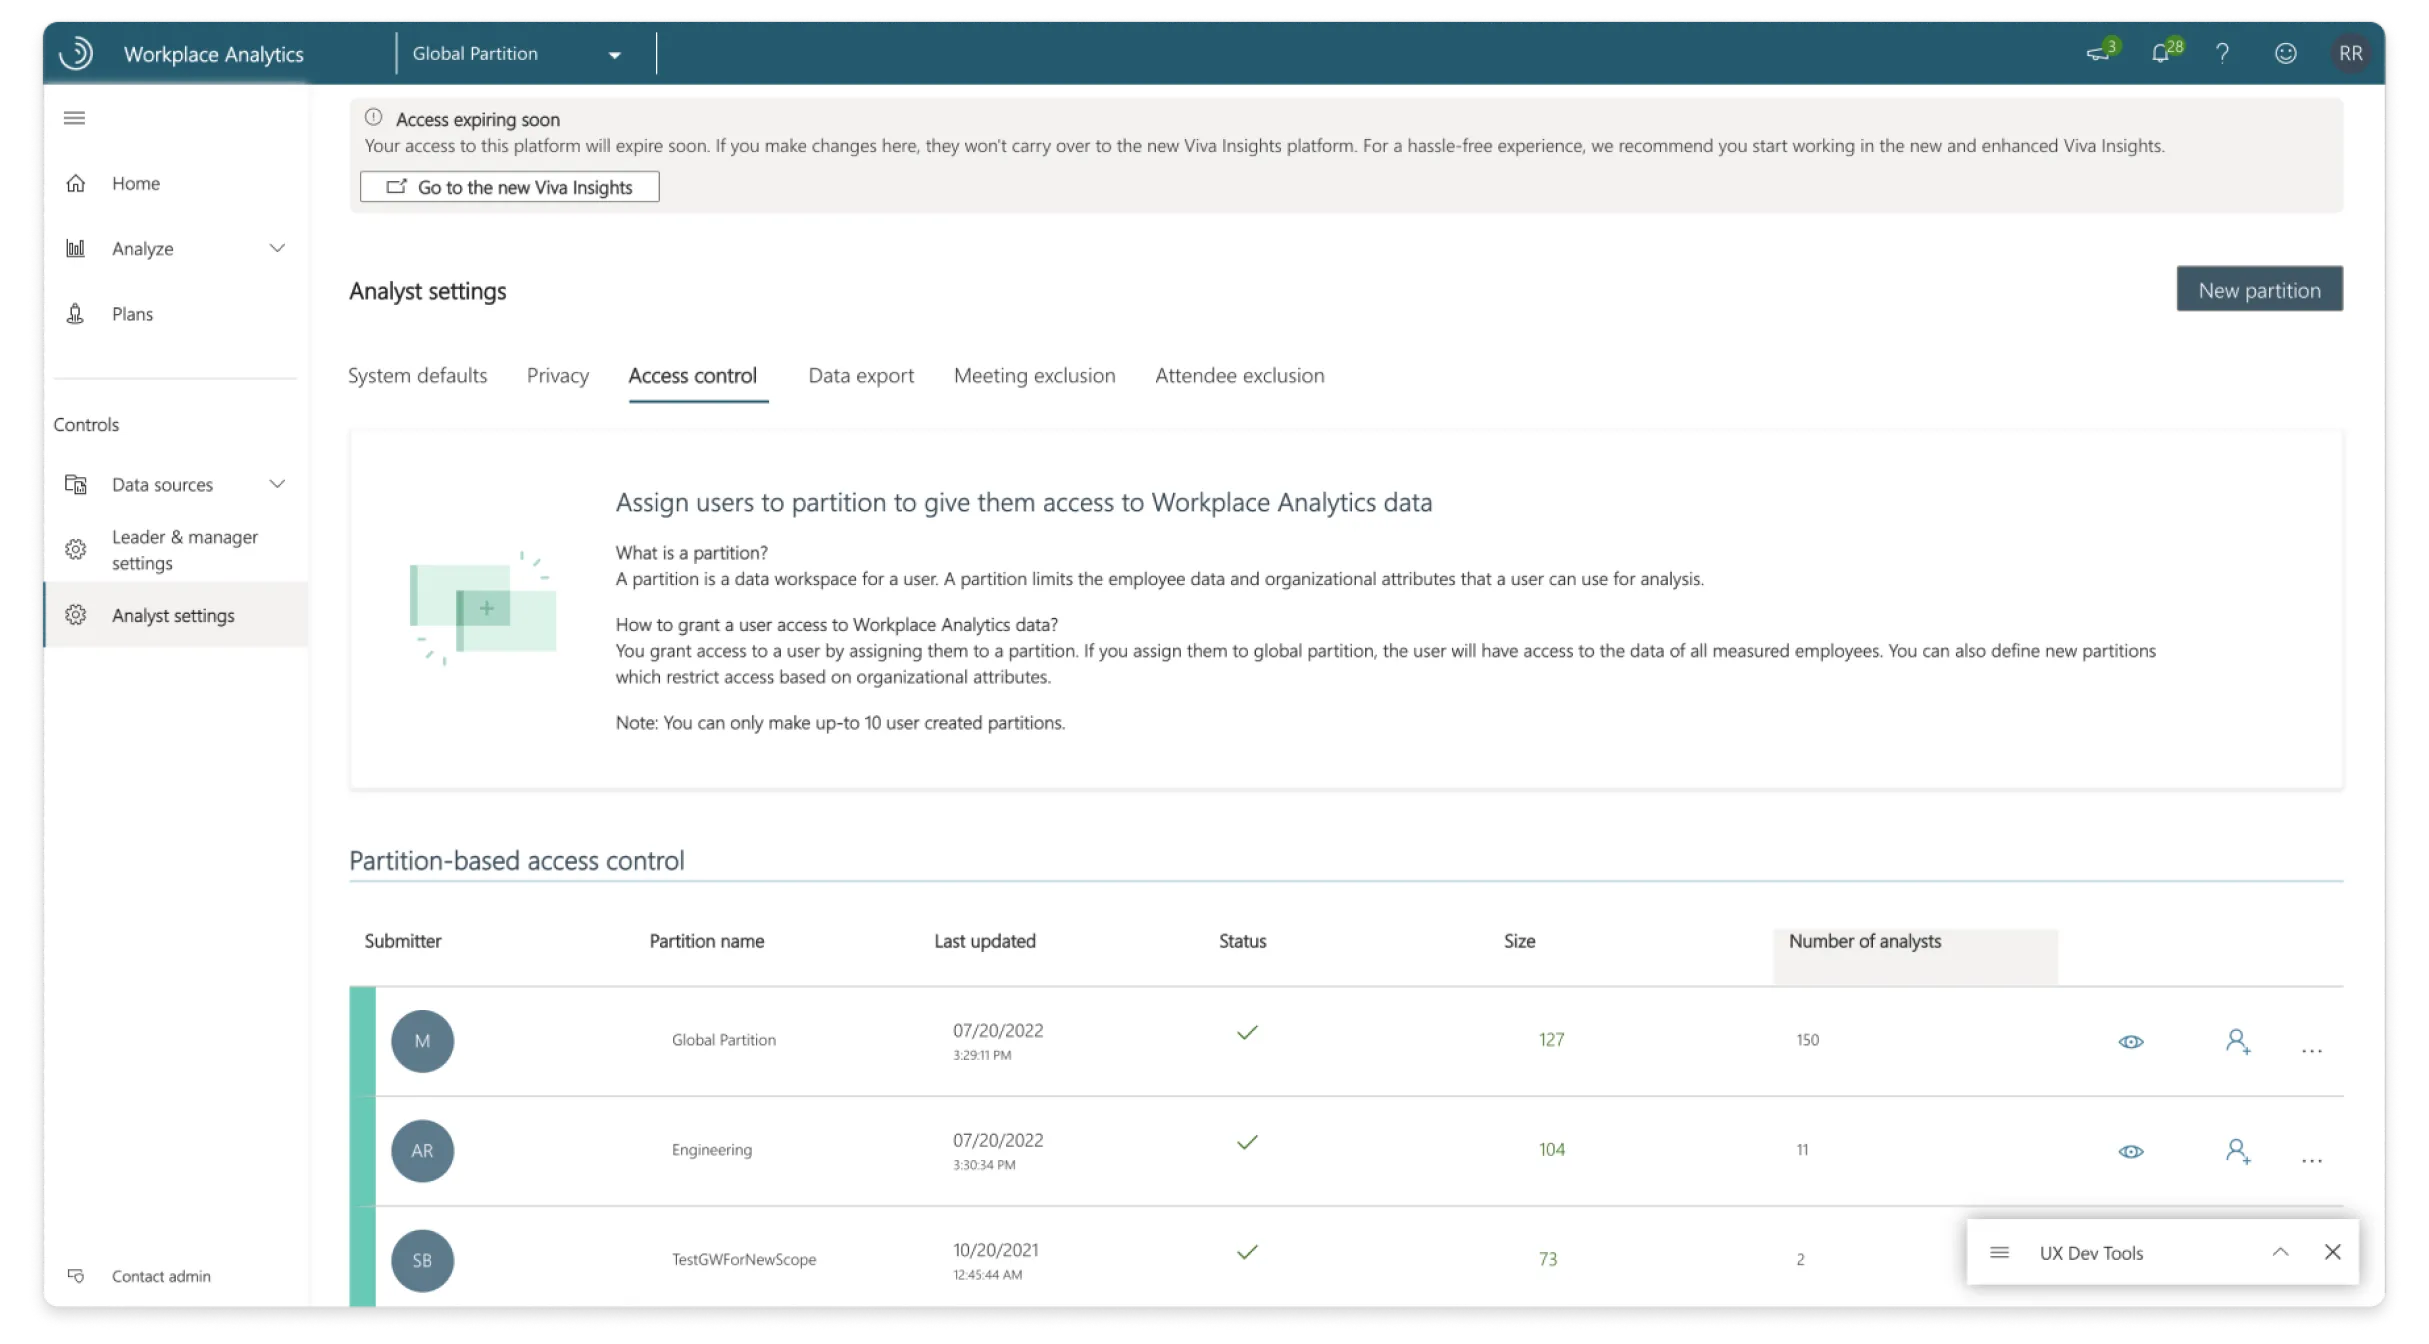
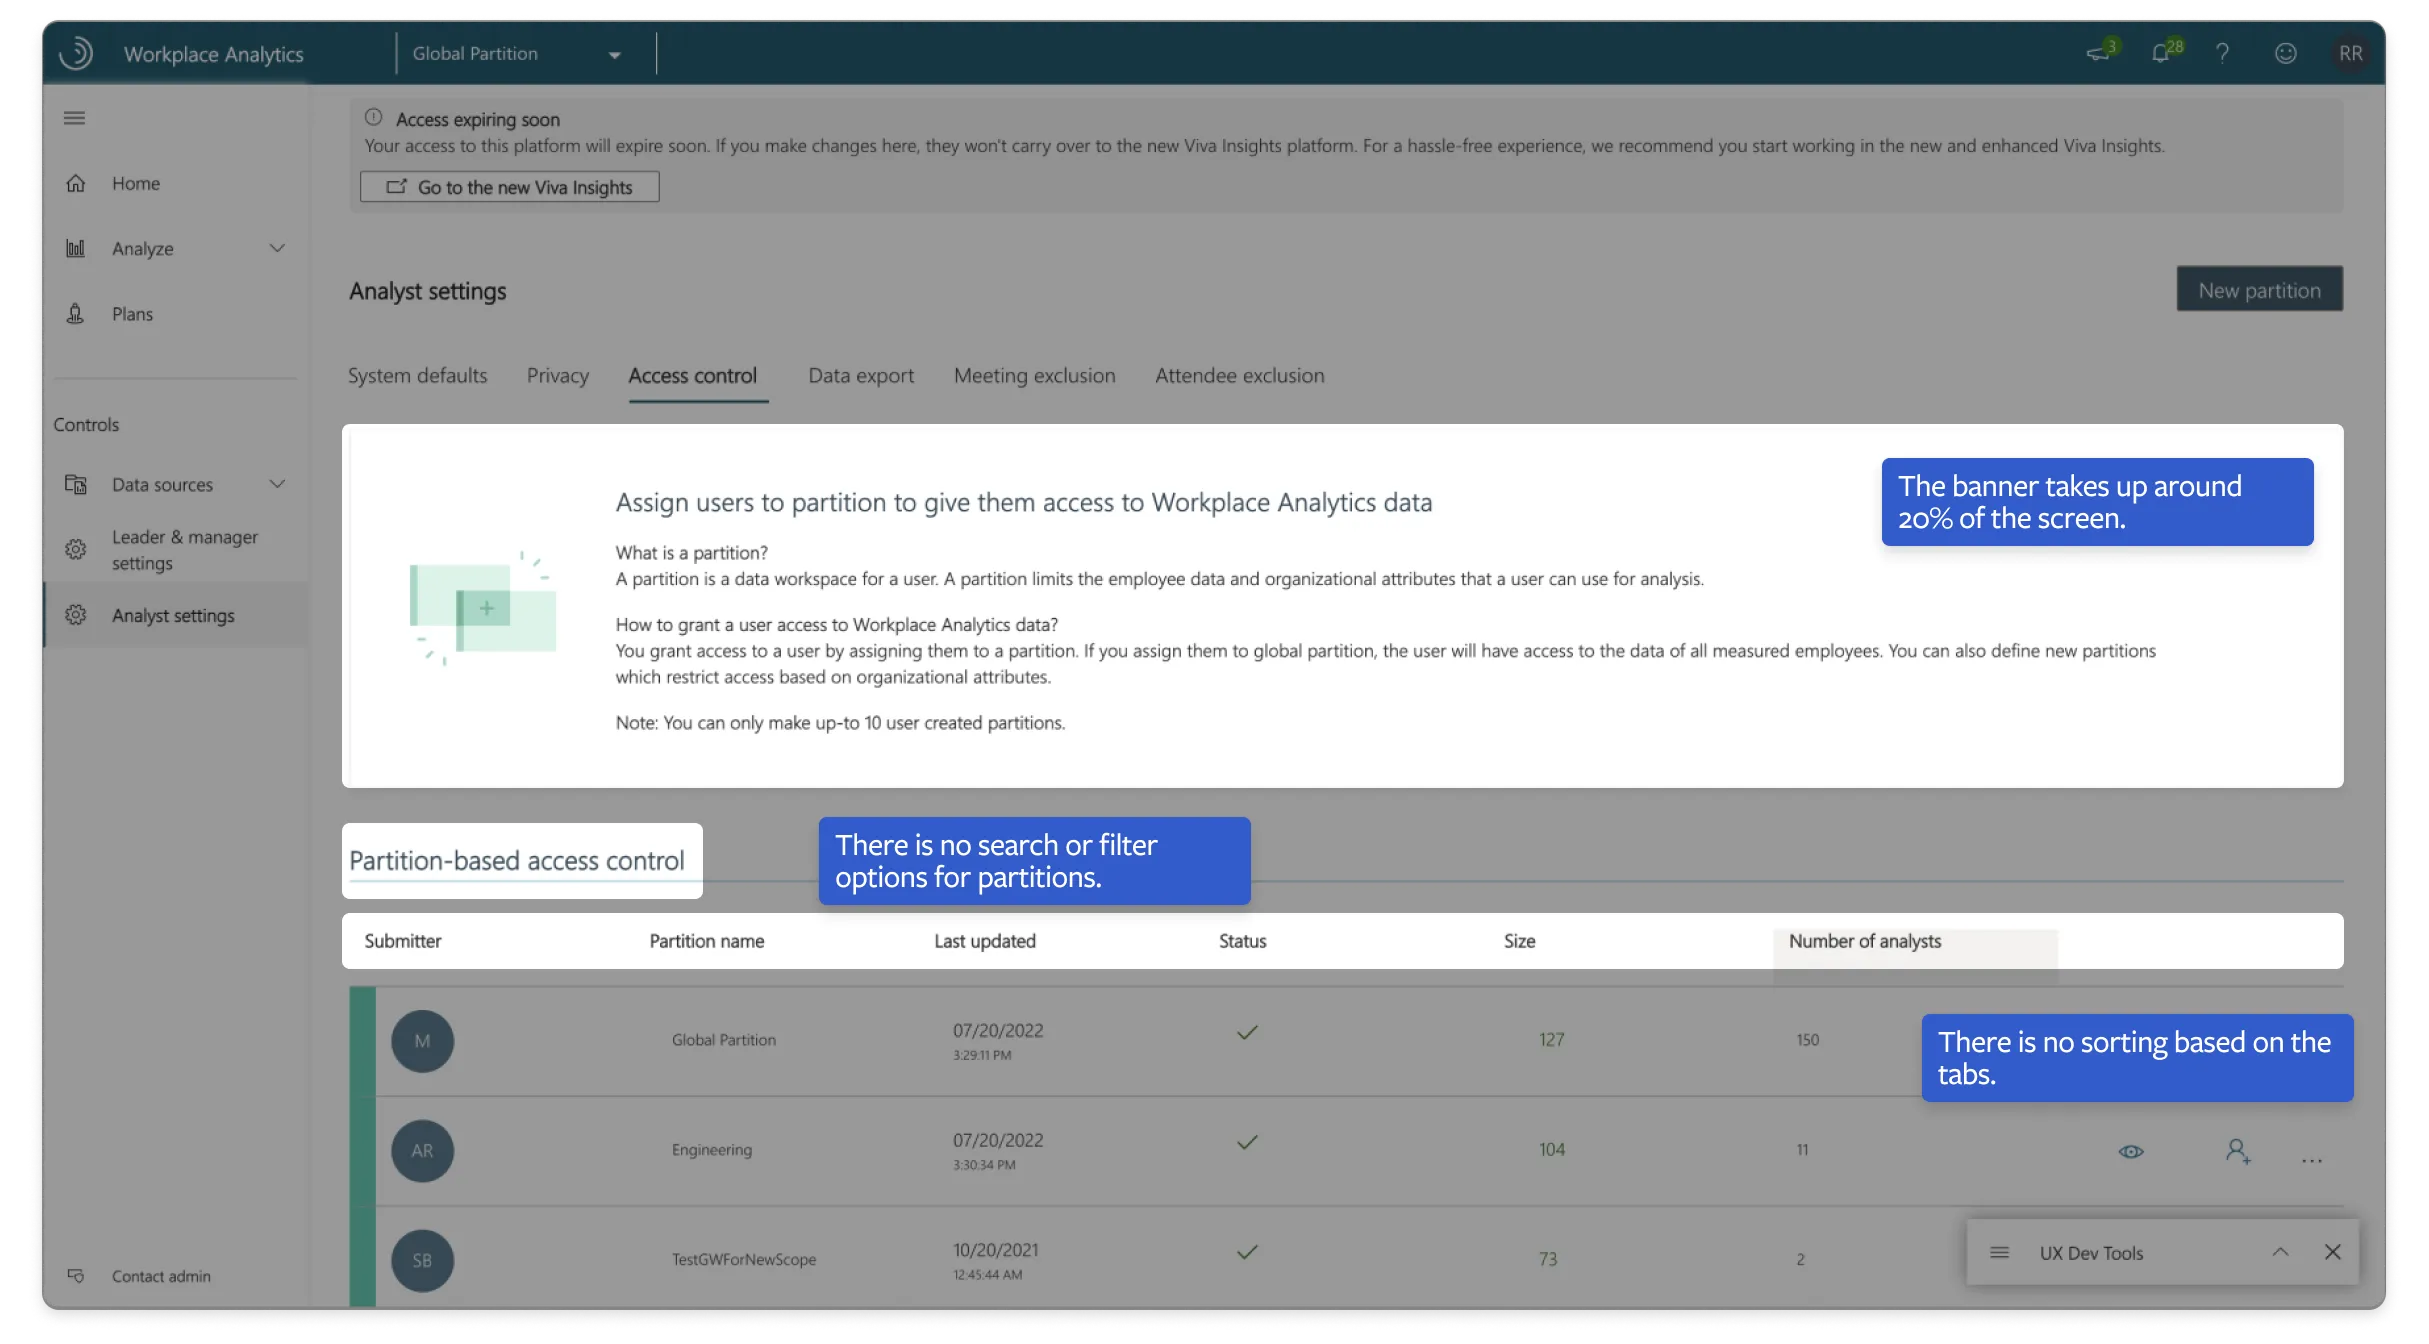
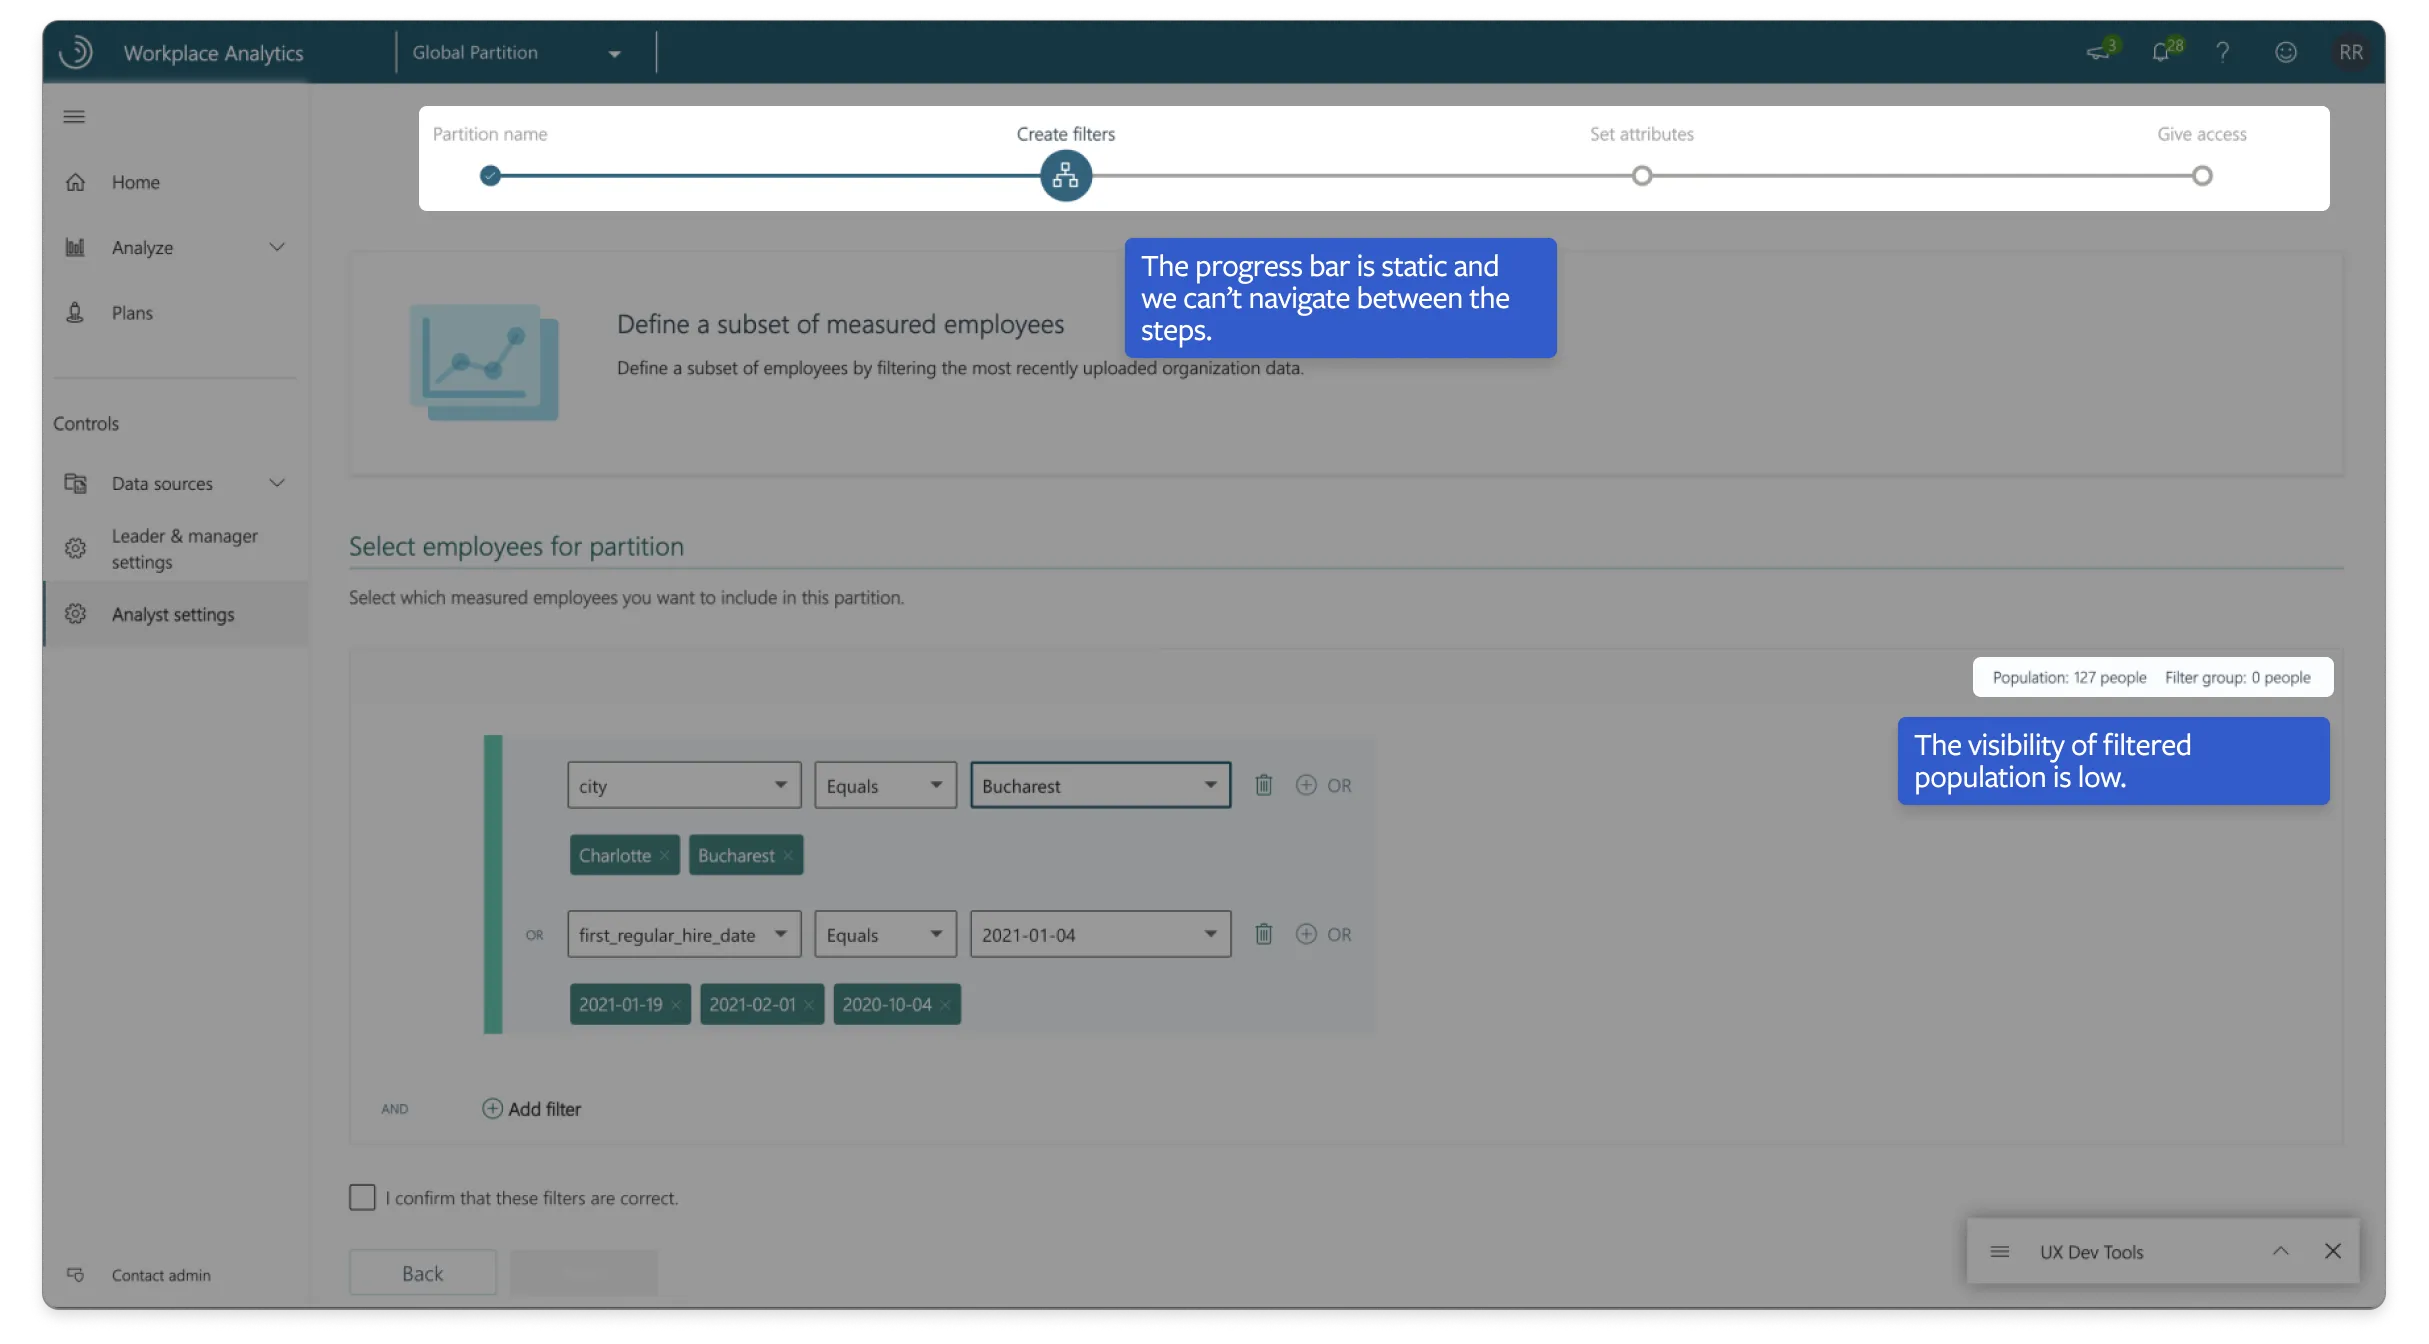
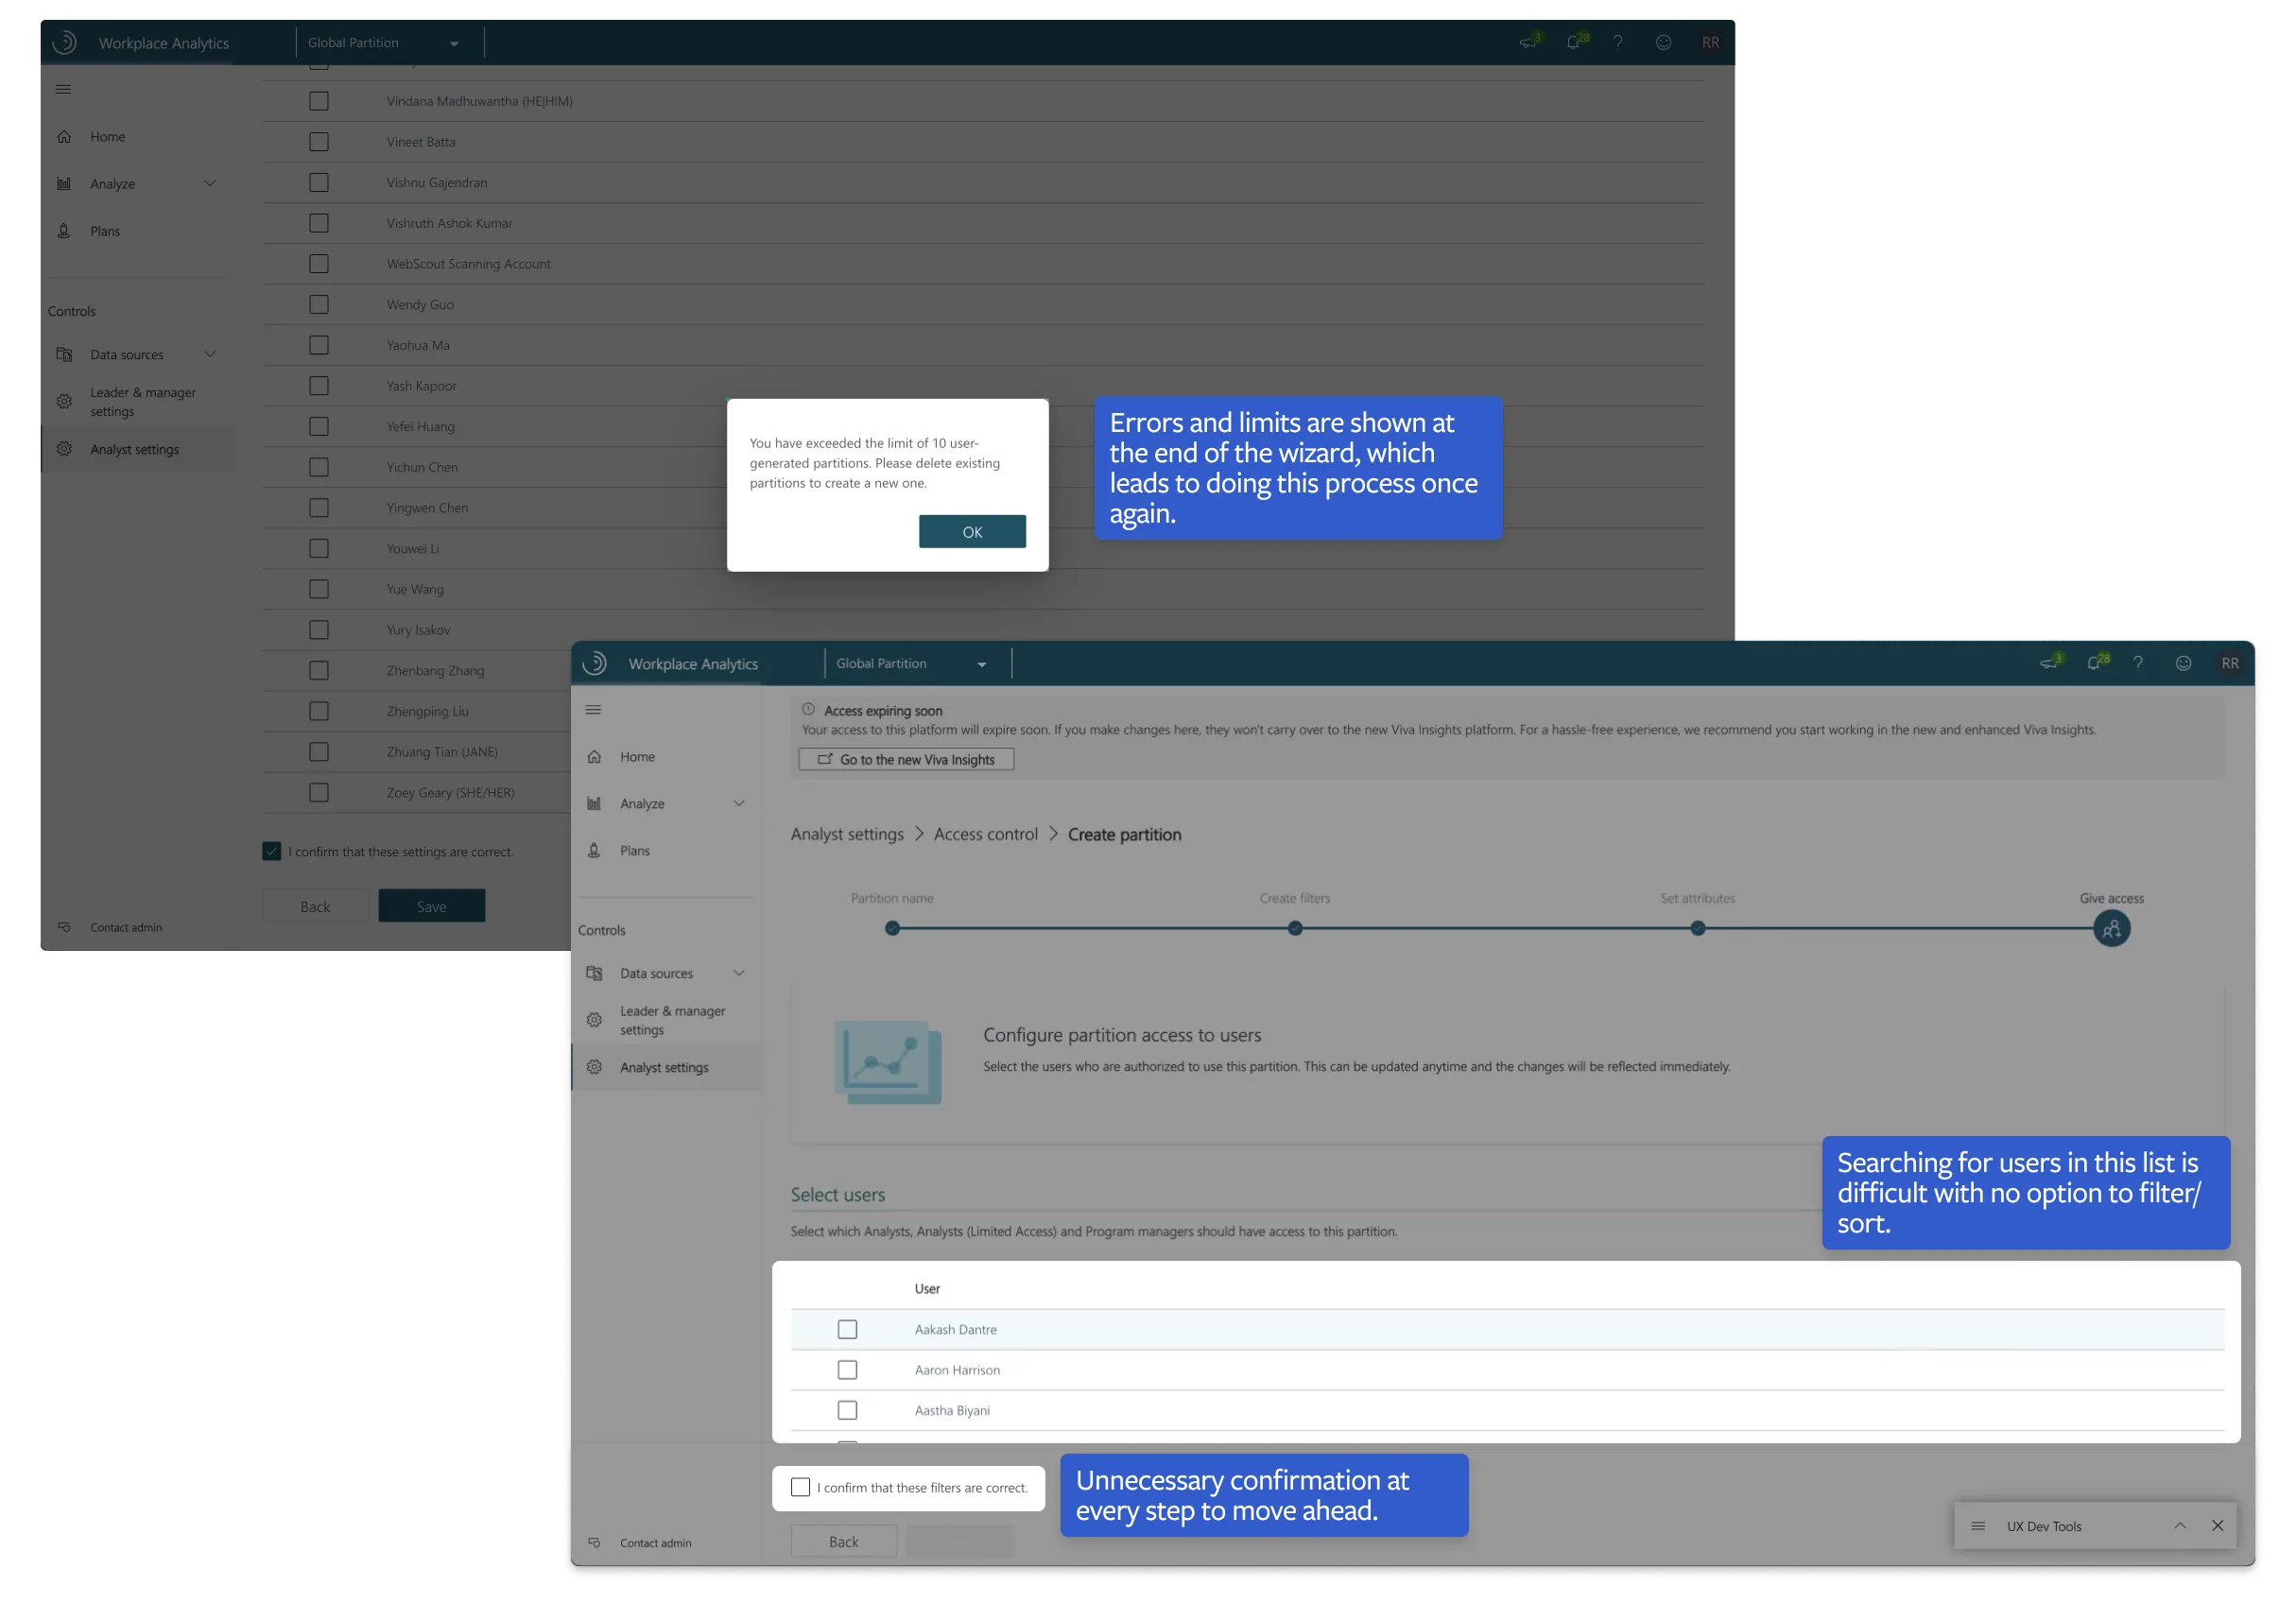
I started off by looking at how Partitions worked in Workplace Analytics (WPA). This gave me a better understanding of how an administrator approached this feature and what their pain points were. A typical partition assignment included four major steps. I was to focus on the CRUD experience of the feature, keeping usability and design finesse in mind.
Hover over the images to see the heuristics.
1. Create partition
When a new analyst is joining the team, an admin wants to create a customised partition and only provide the required data to them, such that they follow the privacy standards set by their firm.
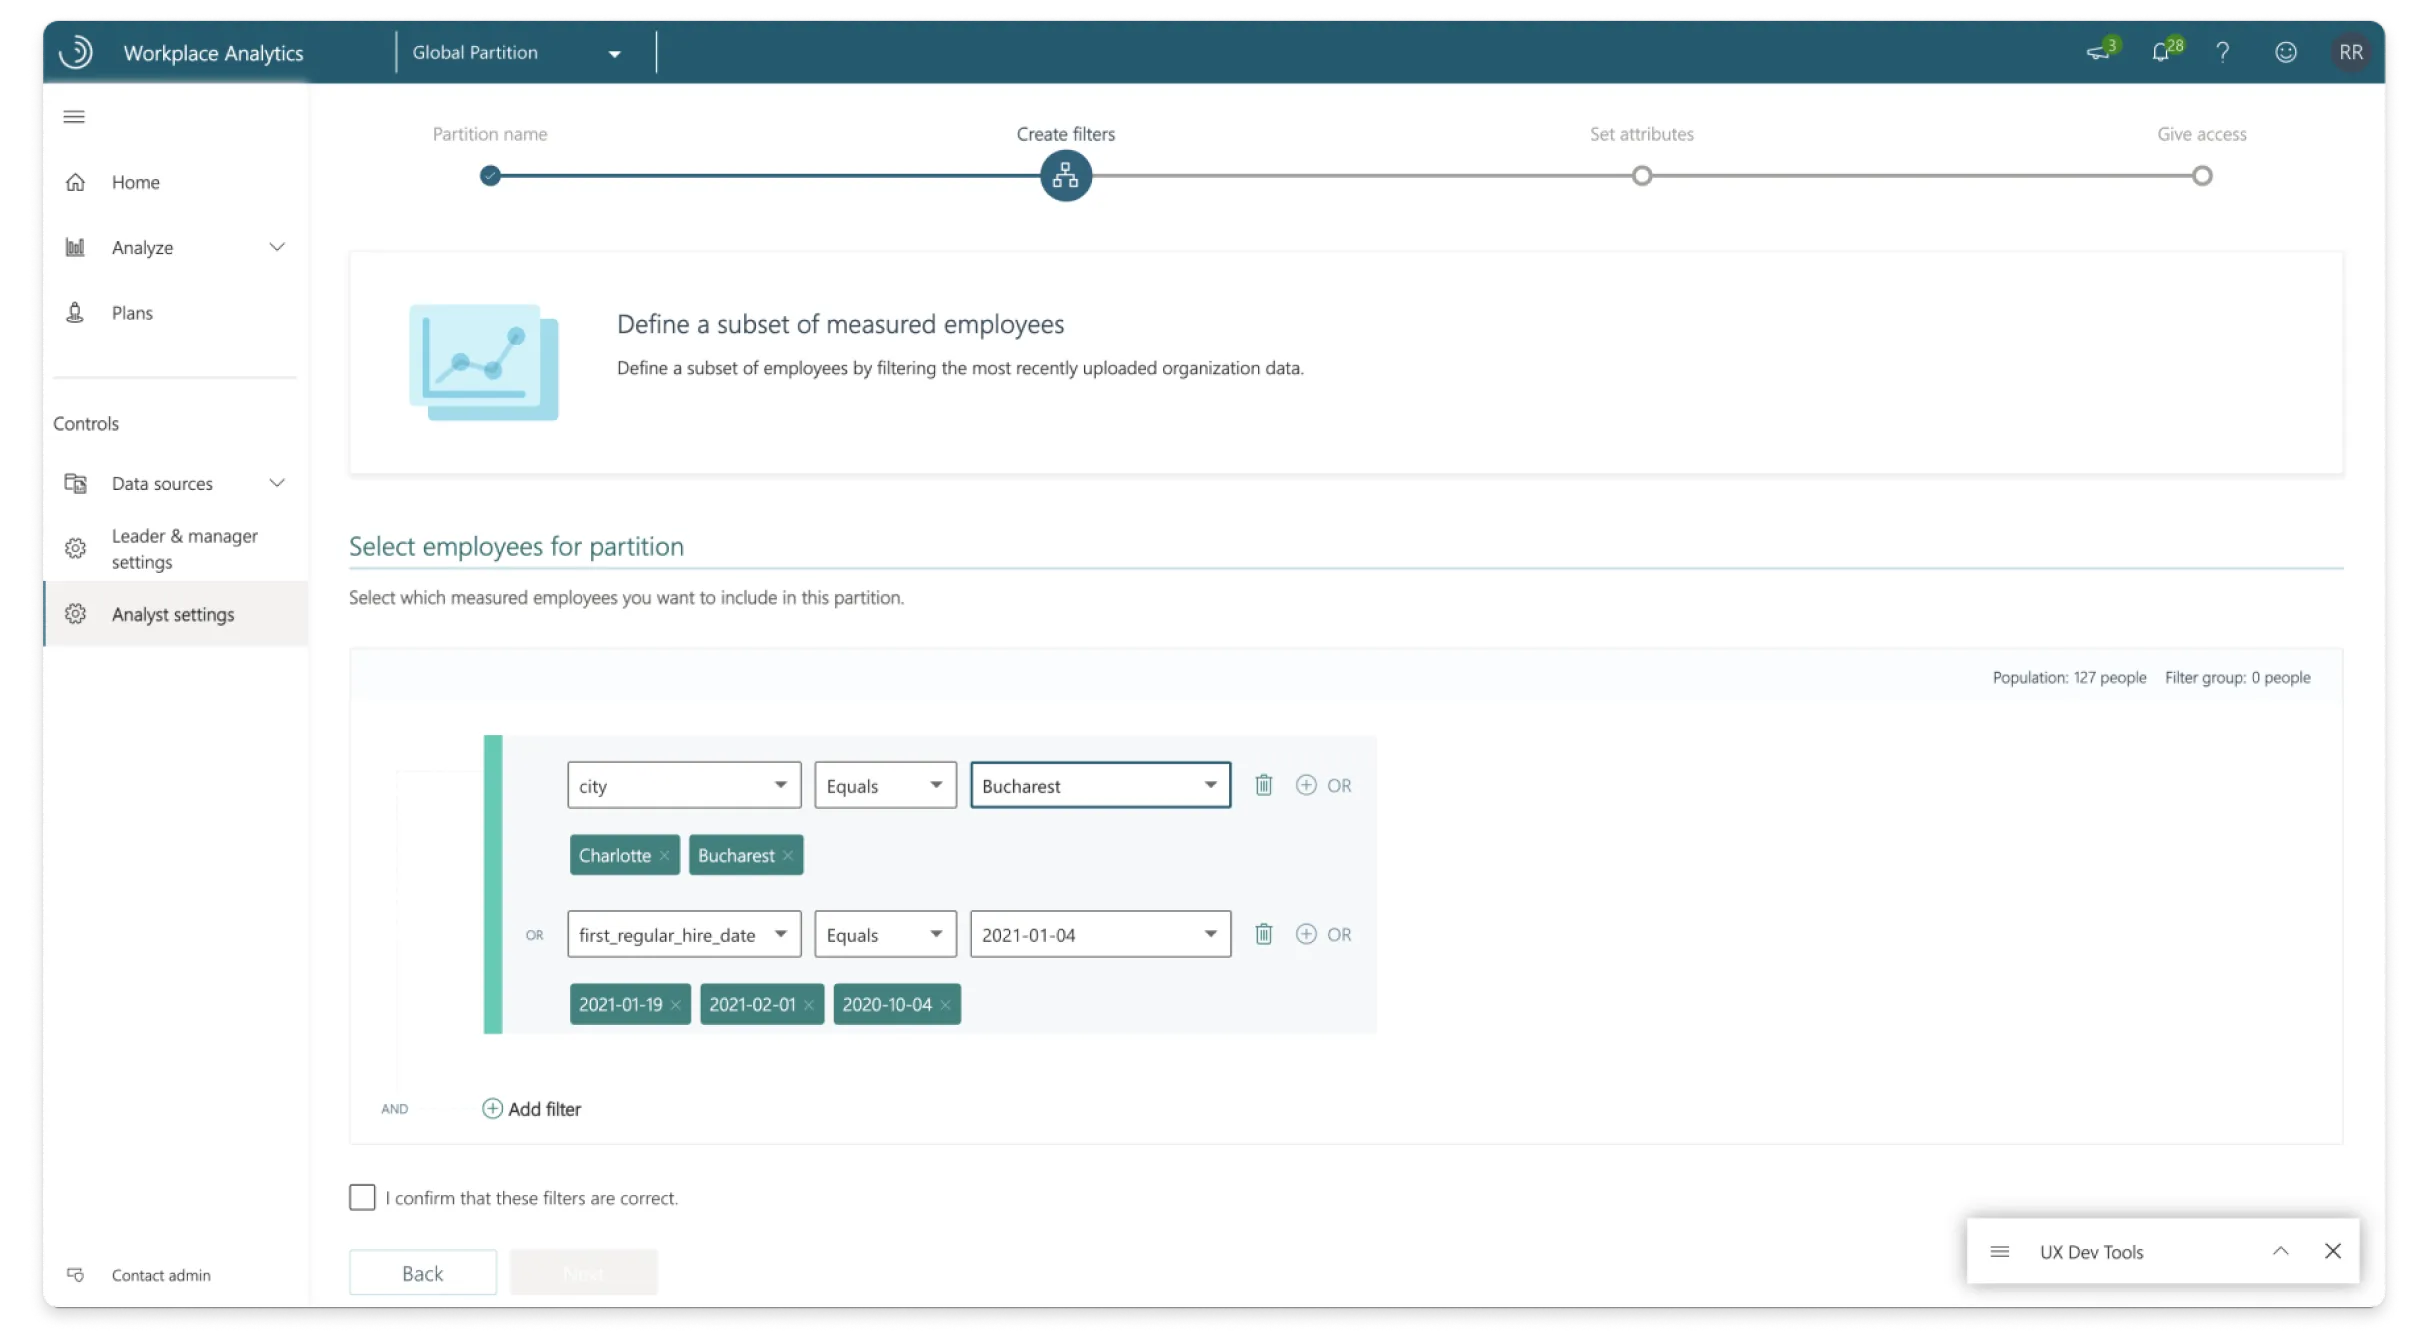
2. Select employees
To filter the right employees so that it is easy for the admin to section off to the analysts.
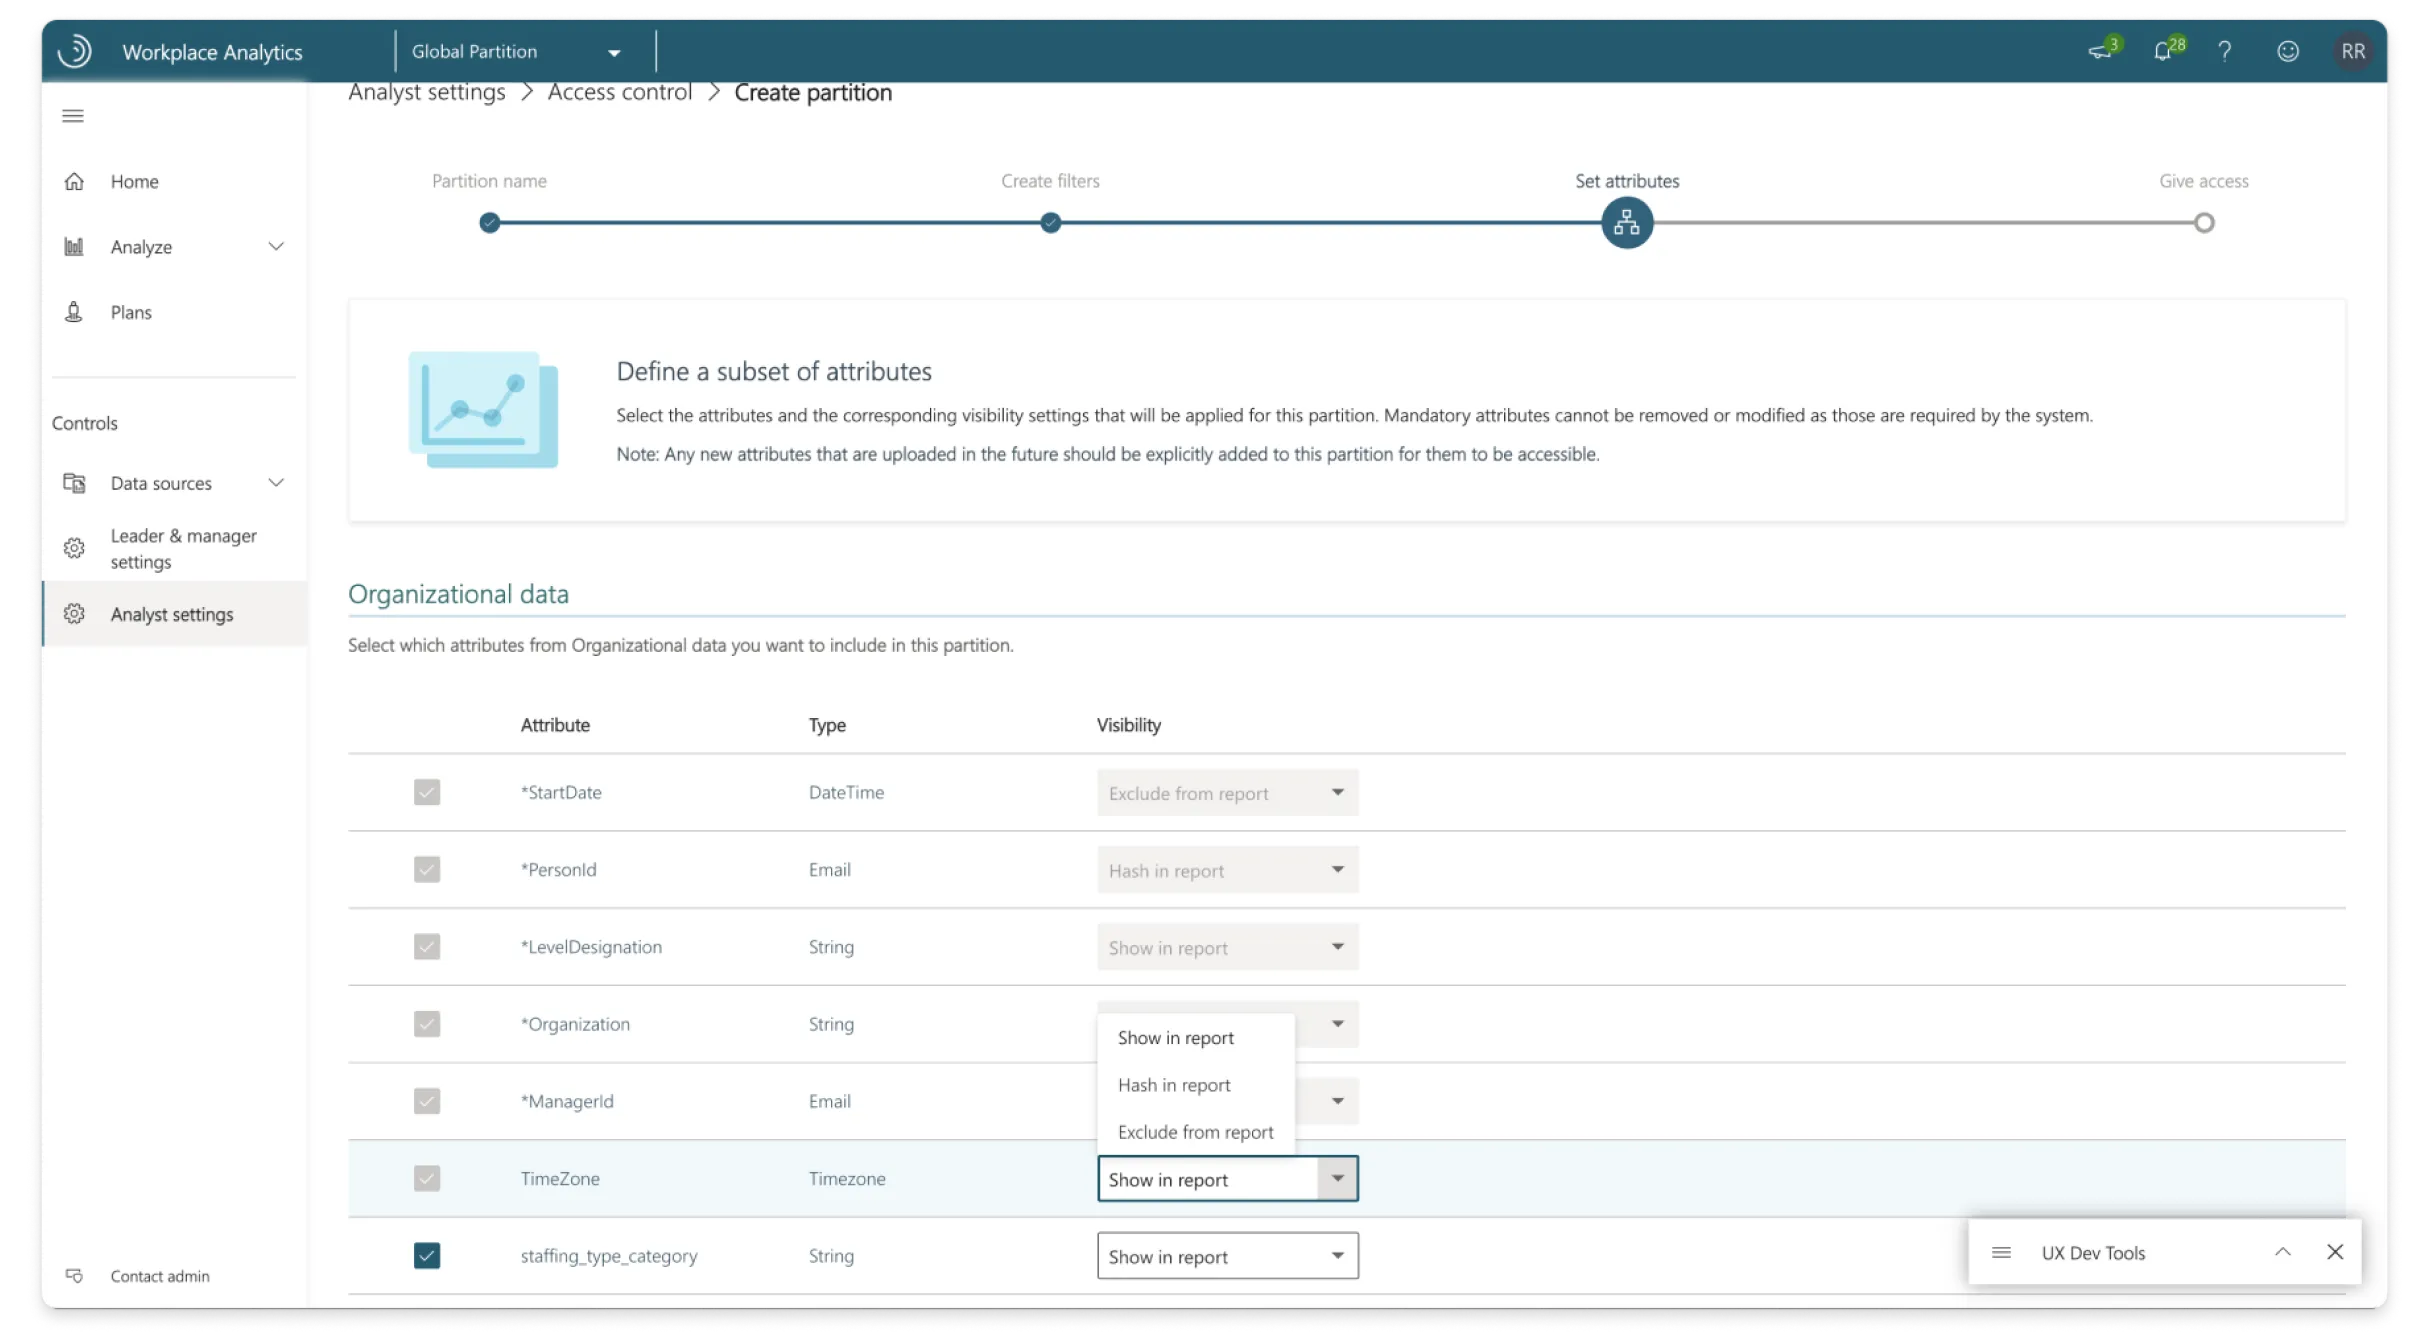
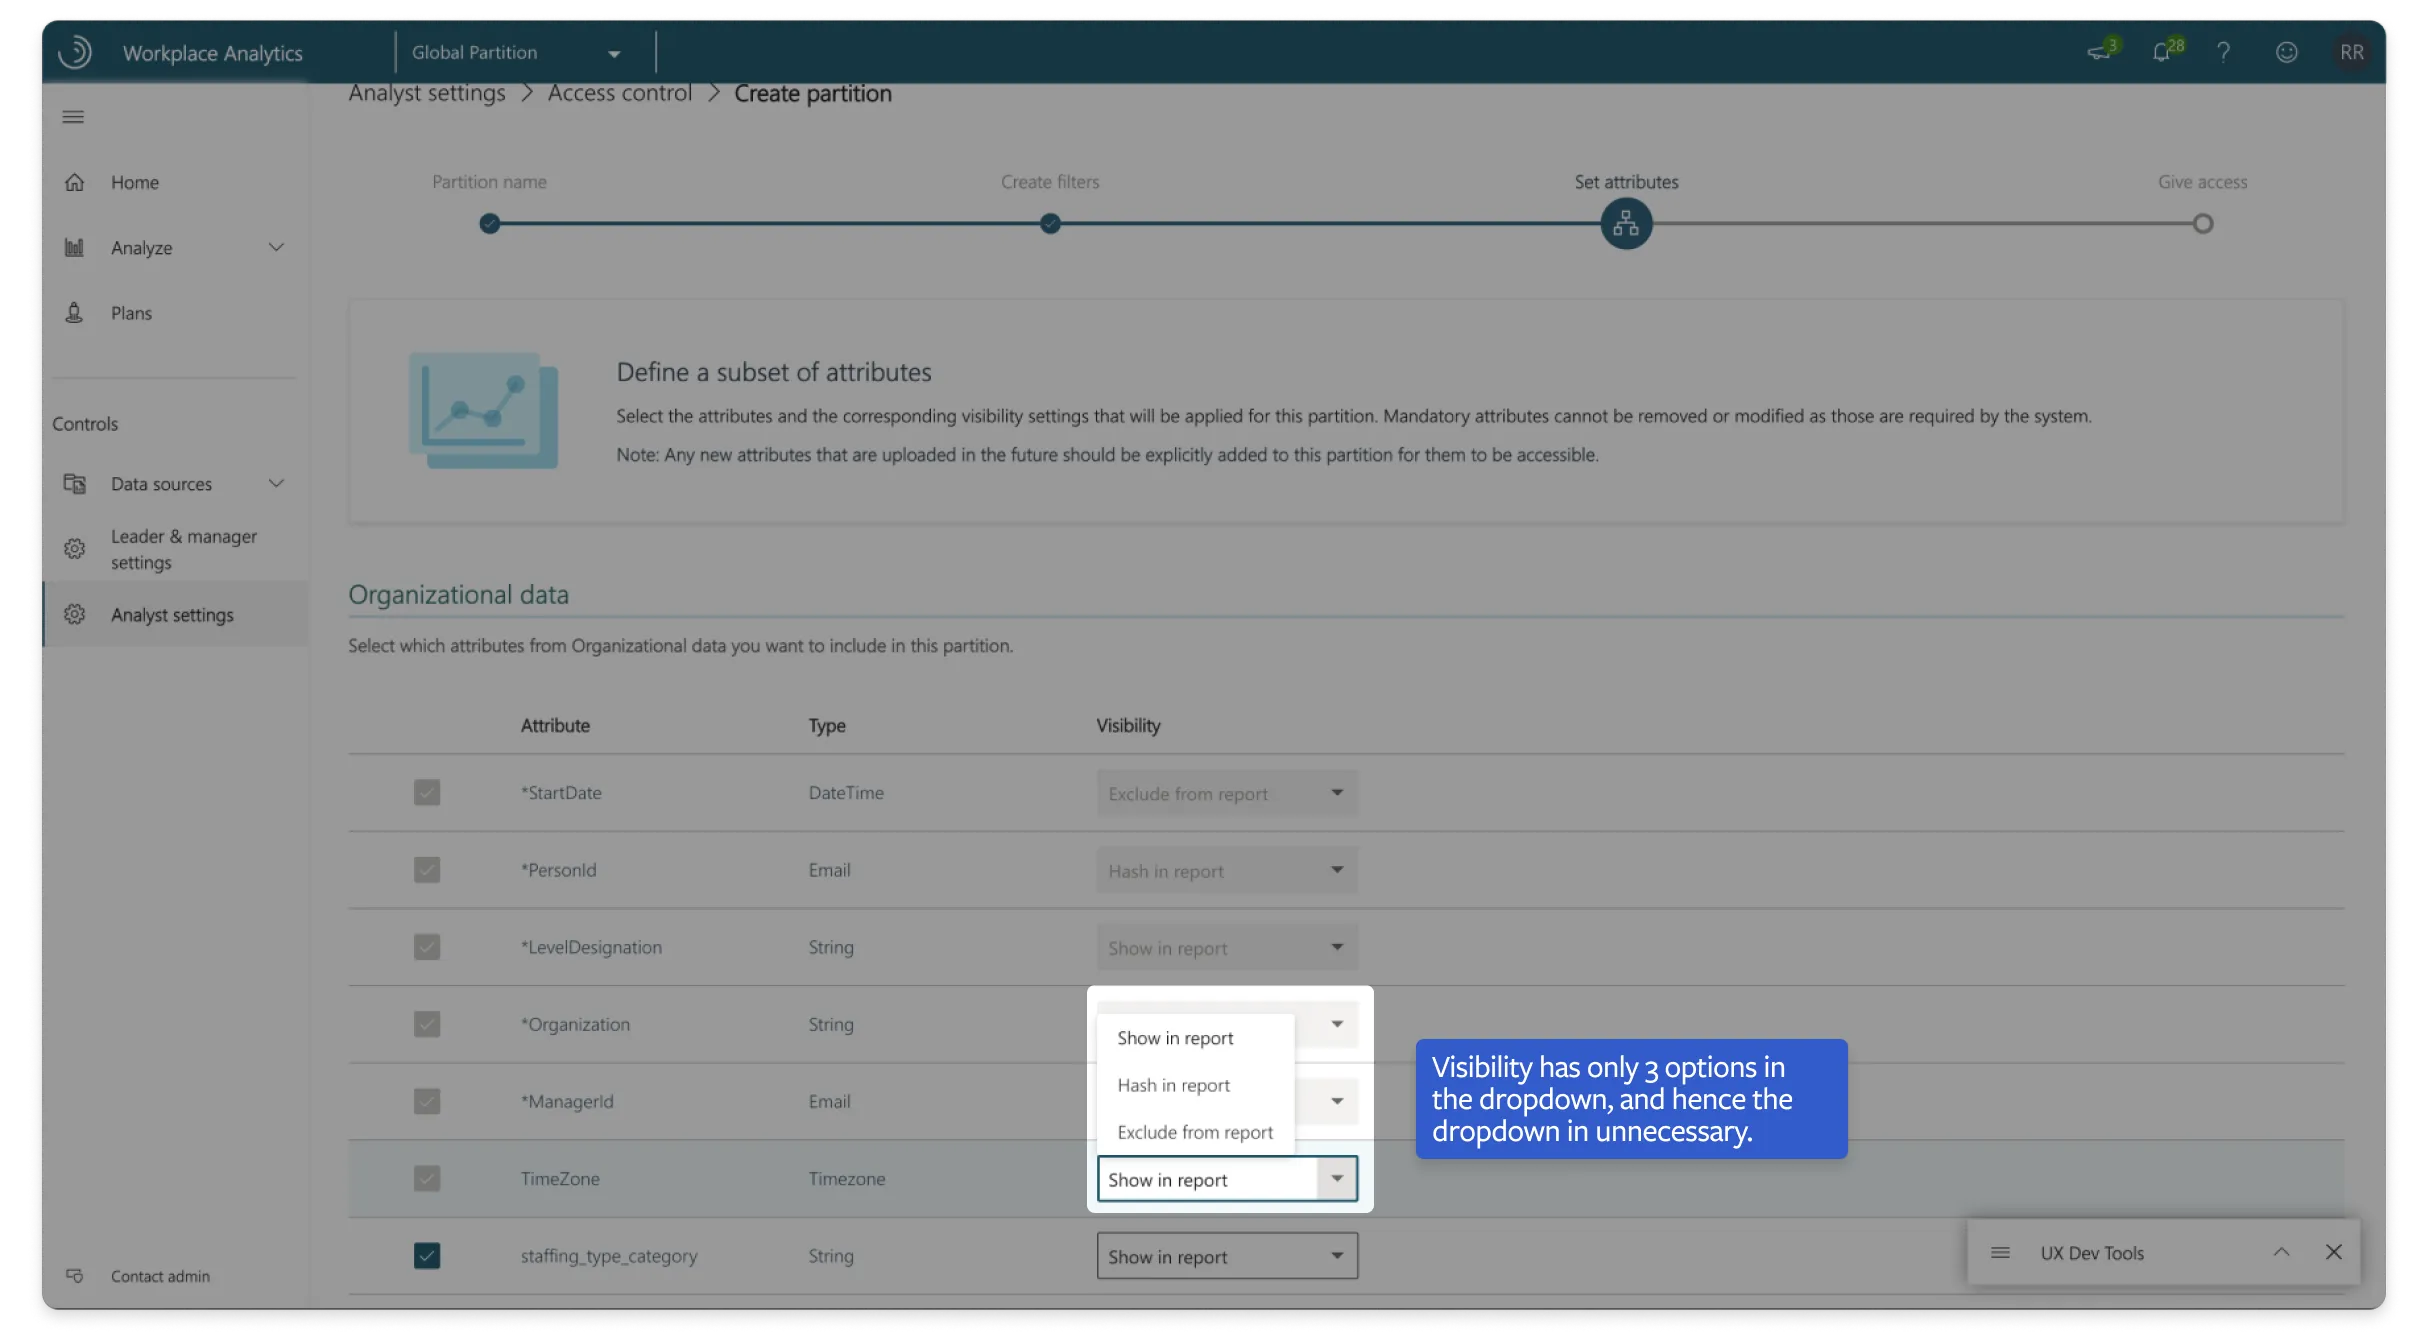
3. Select attributes
To select the right attributes and pick how that attribute should be shown to the analyst.
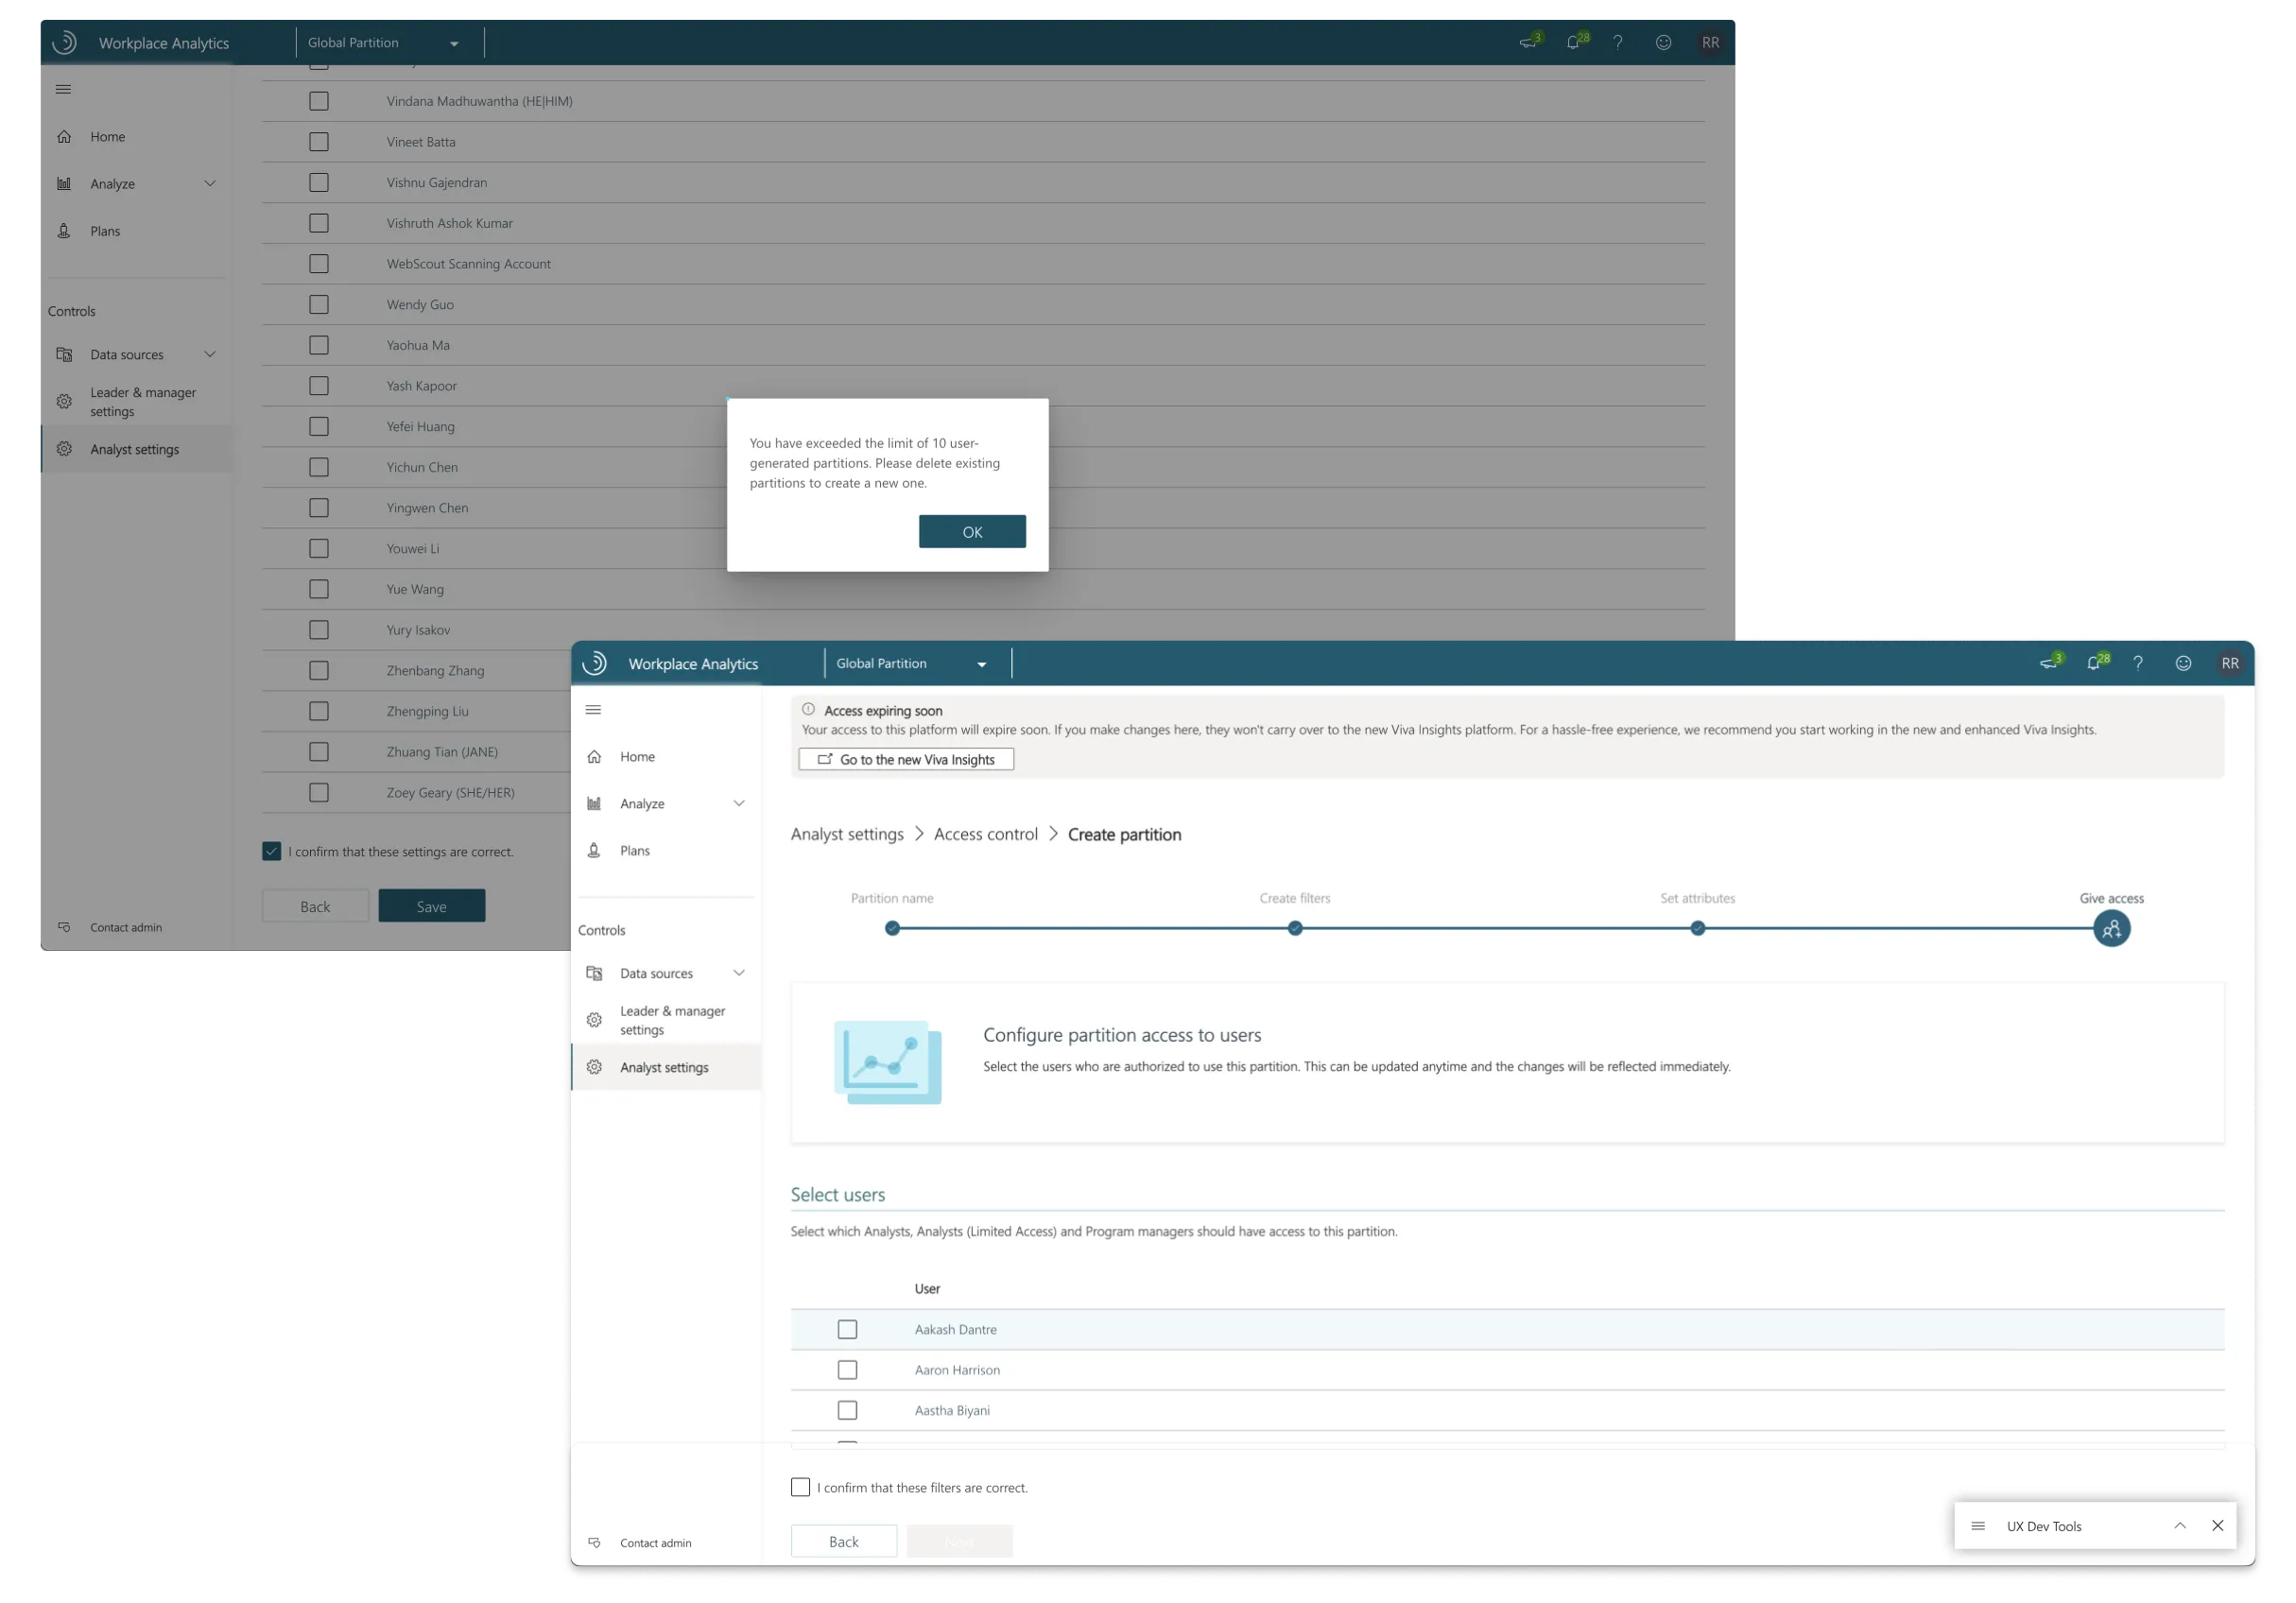
4. Select analysts
To find the right analysts and assign them the partition.
Measuring usability through SUS
Two wizard layouts, settled by the numbers.
We had two wizard layouts to choose between, a step-by-step wizard and a single-pane one, and needed to know which one analysts actually preferred. So we put both in front of users and scored them with the System Usability Scale (SUS), asking them to rate different parts of the experience.
The step-by-step version gave a guided, linear flow that some users found easy to follow. The single-pane version laid everything out at once, which suited power users who wanted quick access to all of it.
The SUS scores came out clearly in favour of one of them, which let us pick a direction with real evidence behind it rather than a hunch.
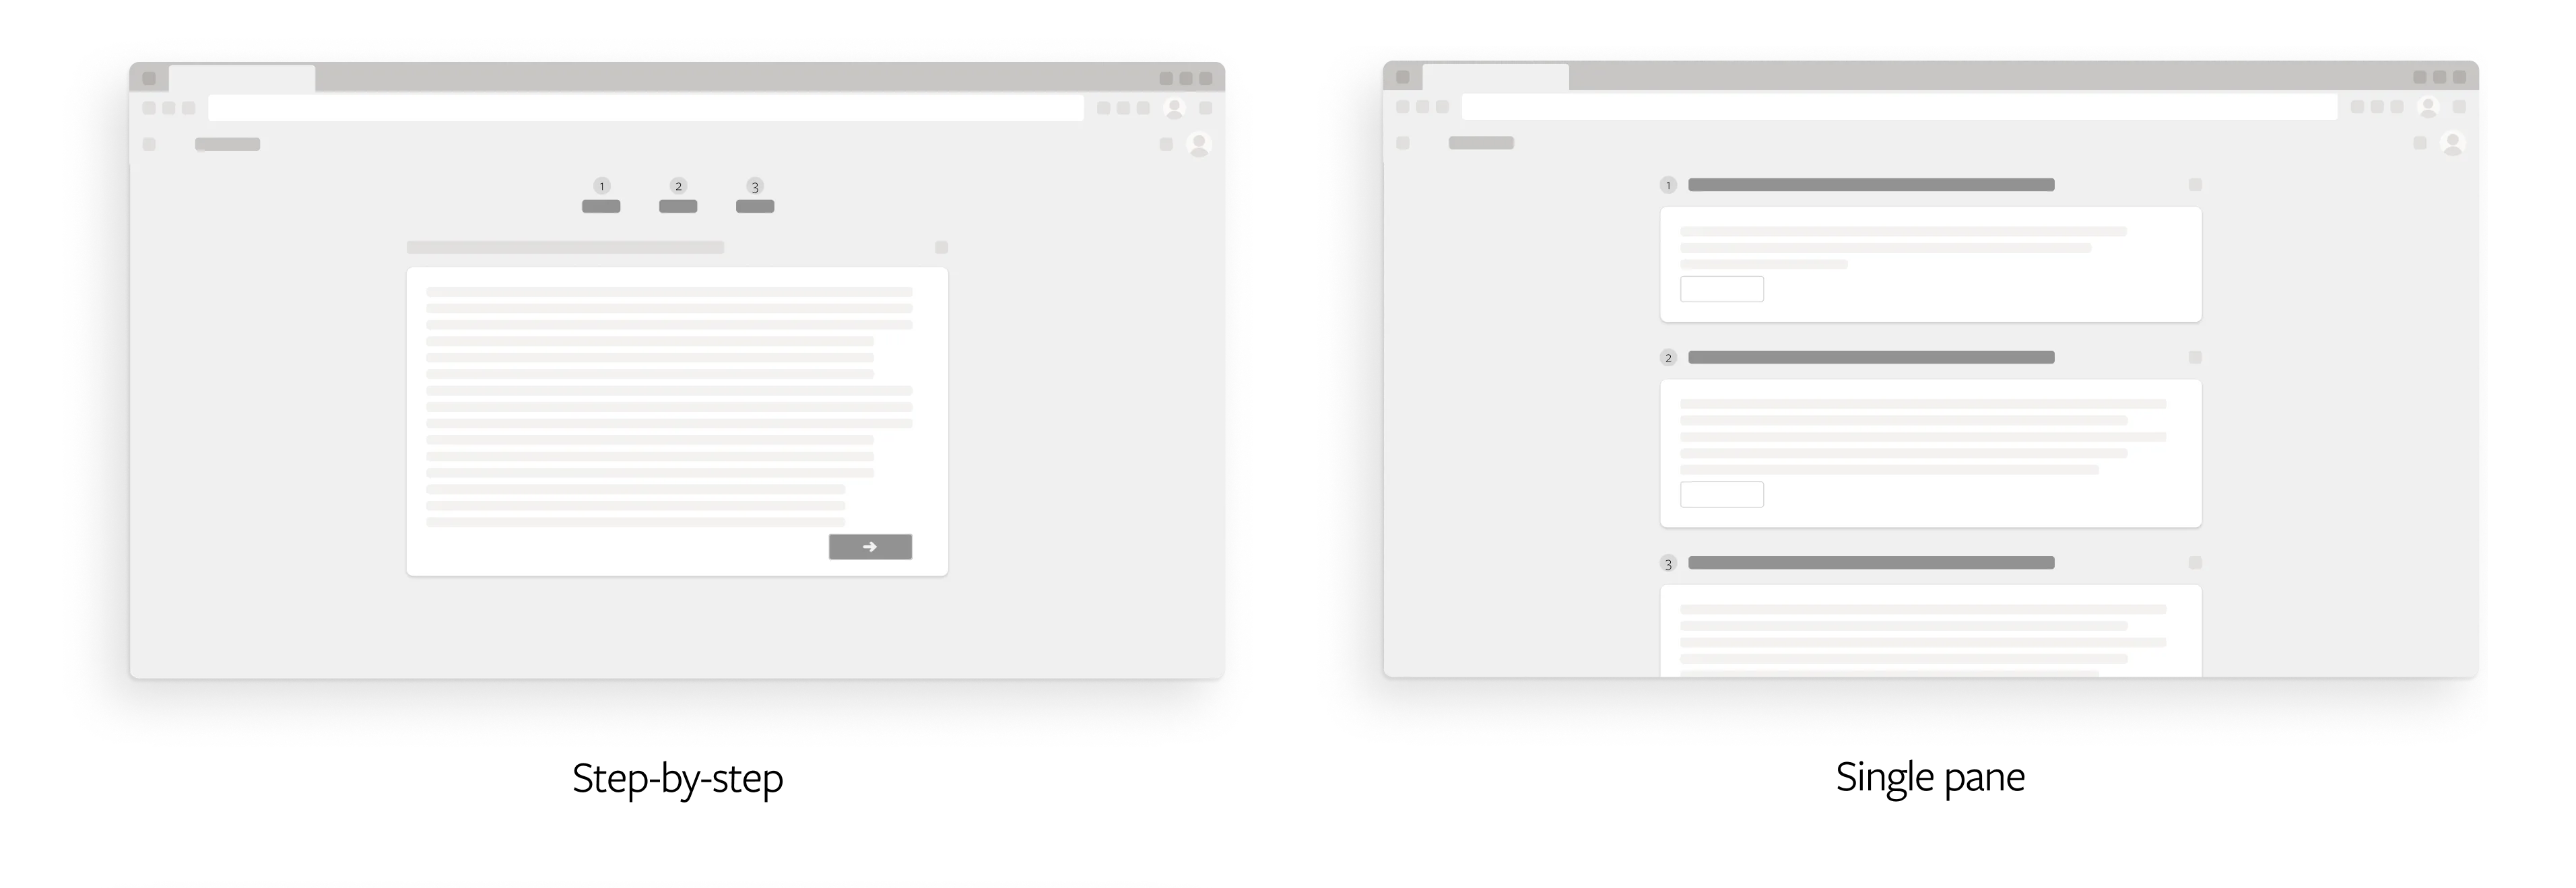
Step-by-step
Average SUS score of 82.5
| Respondent | ST1 | ST2 | ST3 | ST4 | ST5 | ST6 | ST7 | ST8 | ST9 | ST10 | Odd number | Even number | SUS |
|---|---|---|---|---|---|---|---|---|---|---|---|---|---|
| 1. Mei2020 | 3 | 1 | 5 | 1 | 5 | 1 | 4 | 1 | 5 | 4 | 17 | 17 | 85 |
| 2. ElizaMae | 4 | 2 | 4 | 2 | 4 | 2 | 4 | 1 | 2 | 1 | 13 | 17 | 75 |
| 3. schmitozen | 3 | 1 | 5 | 2 | 4 | 1 | 3 | 2 | 4 | 3 | 14 | 16 | 75 |
| 4. TurlowOne | 5 | 2 | 5 | 1 | 5 | 5 | 5 | 1 | 5 | 1 | 20 | 15 | 87.5 |
| 5. 1140 | 5 | 2 | 4 | 2 | 5 | 1 | 5 | 2 | 5 | 1 | 19 | 17 | 90 |
Single Pane
Average SUS score of 92.5
| Respondent | ST1 | ST2 | ST3 | ST4 | ST5 | ST6 | ST7 | ST8 | ST9 | ST10 | Odd number | Even number | SUS |
|---|---|---|---|---|---|---|---|---|---|---|---|---|---|
| 1. alpinenepal | 5 | 1 | 5 | 1 | 4 | 1 | 5 | 1 | 5 | 2 | 19 | 19 | 95 |
| 2. Im0102 | 5 | 1 | 5 | 1 | 5 | 1 | 4 | 1 | 5 | 1 | 19 | 20 | 97.5 |
| 3. Odin2020 | 4 | 1 | 5 | 1 | 3 | 2 | 5 | 1 | 4 | 2 | 16 | 18 | 85 |
| 4. ricesj | 4 | 1 | 5 | 1 | 5 | 1 | 4 | 1 | 5 | 2 | 18 | 19 | 92.5 |
| 5. spunk52 | 5 | 1 | 5 | 1 | 3 | 1 | 5 | 1 | 4 | 1 | 17 | 20 | 92.5 |
Partition switcher
Making it easy to switch while working.
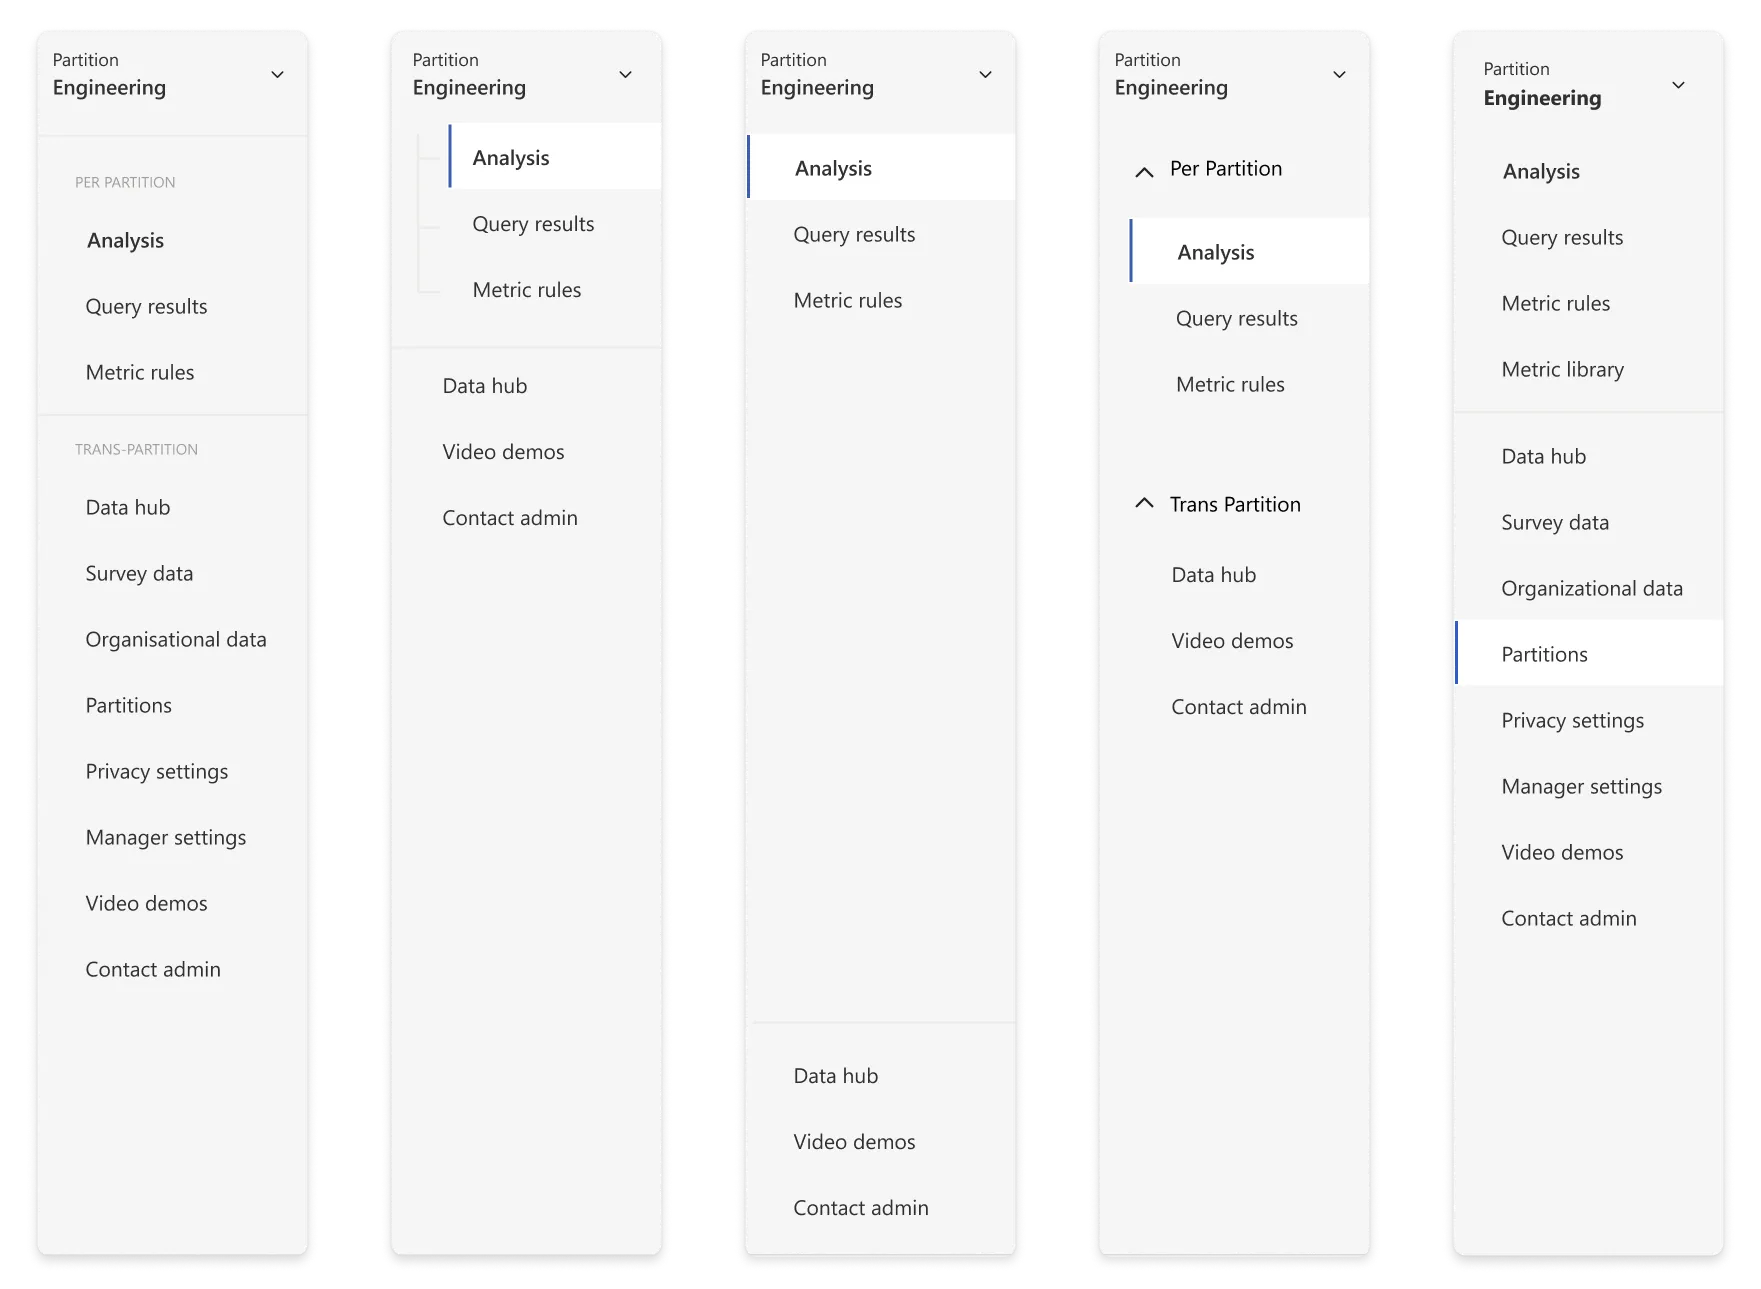
When an analyst handles multiple partitions, they need an easy way to switch between them. Thus, we needed a switcher. Our surveys indicated the side navigation as the ideal location for the switcher.
A dropdown was the best option as it easily lays out multiple items in a list. Description was also added with every partition so that it's easier for the user to identify what partition it is.
However, the challenge was to differentiate partition-specific pages from global pages to avoid confusion. We had multiple iterations for this. In the end, we decided to go with a simple horizontal line between the pages to make it as easy as possible for the admin to understand without complicating the navigation.
Toggle and onboarding
Turning it on, without scaring admins off.
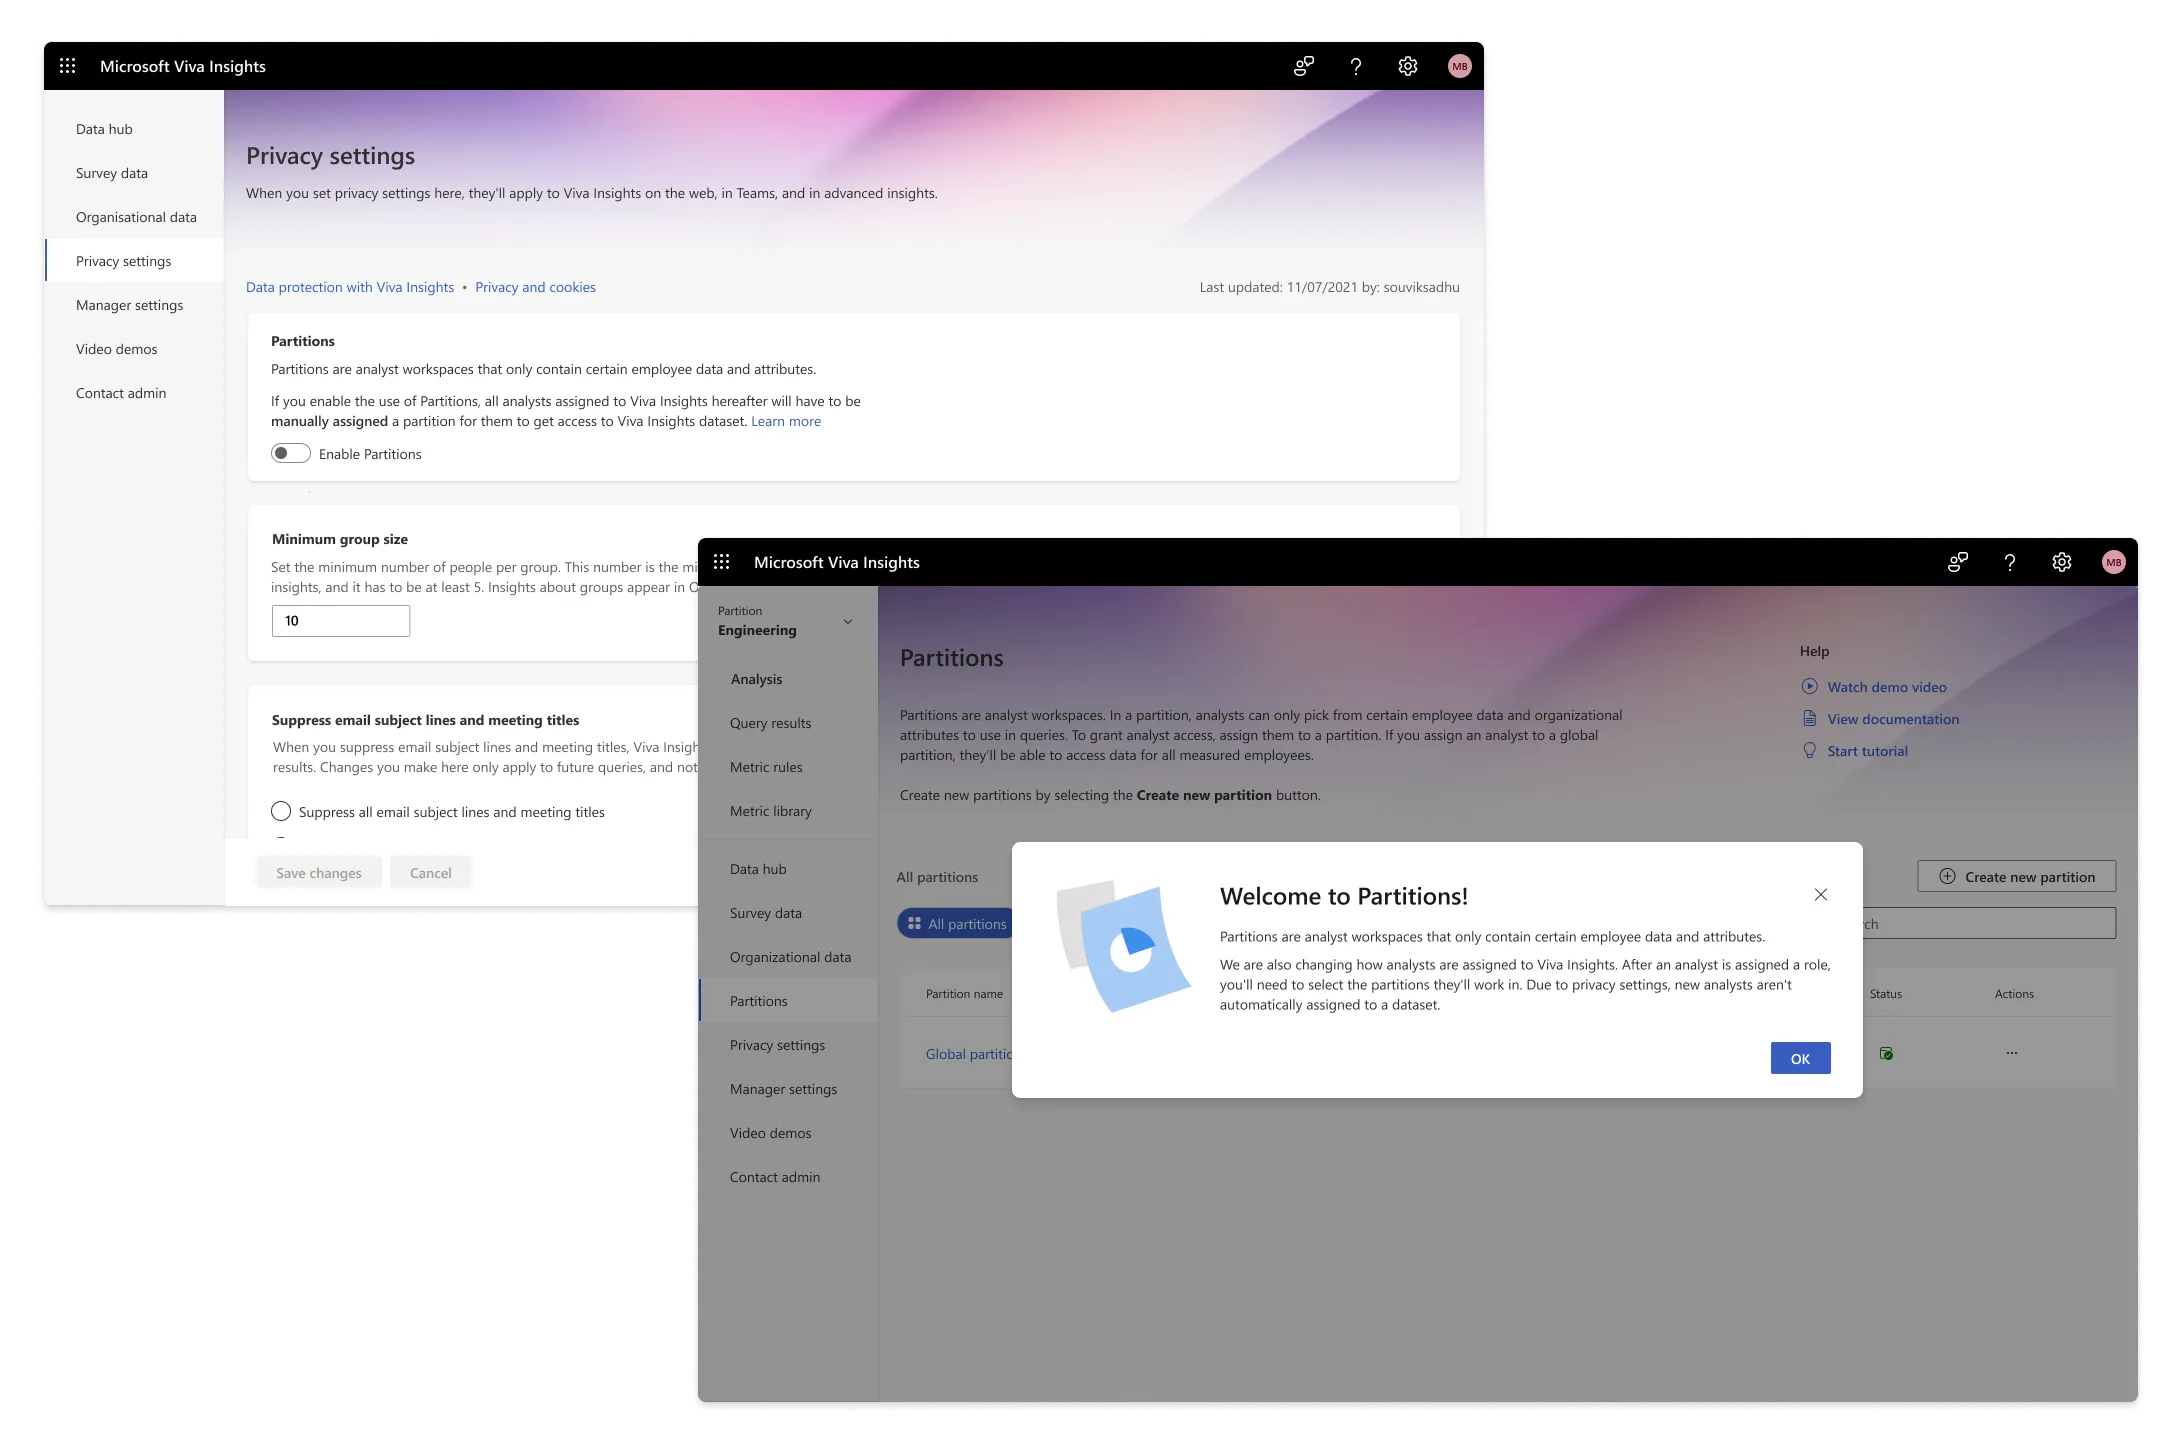
The final part of our puzzle was figuring out how to let admins enable Partitions for their tenant. The tricky part here is that once Partitions is enabled, analysts will have to be manually assigned to at least one partition to work on Viva Insights and conduct analysis. This is a shift in paradigm for the admins, as before Partitions, any analyst assigned to Viva Insights in the Microsoft Admin Center would automatically get access to all data.
Educating our admins about this change without adding too much friction (so that our admins don’t get scared of the feature and decide not to use it) was our final hurdle before GA.
The modal experience
We first tried out a modal experience when the user first landed on the page. This explains what Partitions is and how the analyst onboarding experience has been changed. We realised from our user testing that they rarely read the body text, especially when it’s this long. Moreover, the information is only conveyed to the admin if they enter the ‘Partitions’ homepage. This would lead to confusion for admins who may not have visited the page.
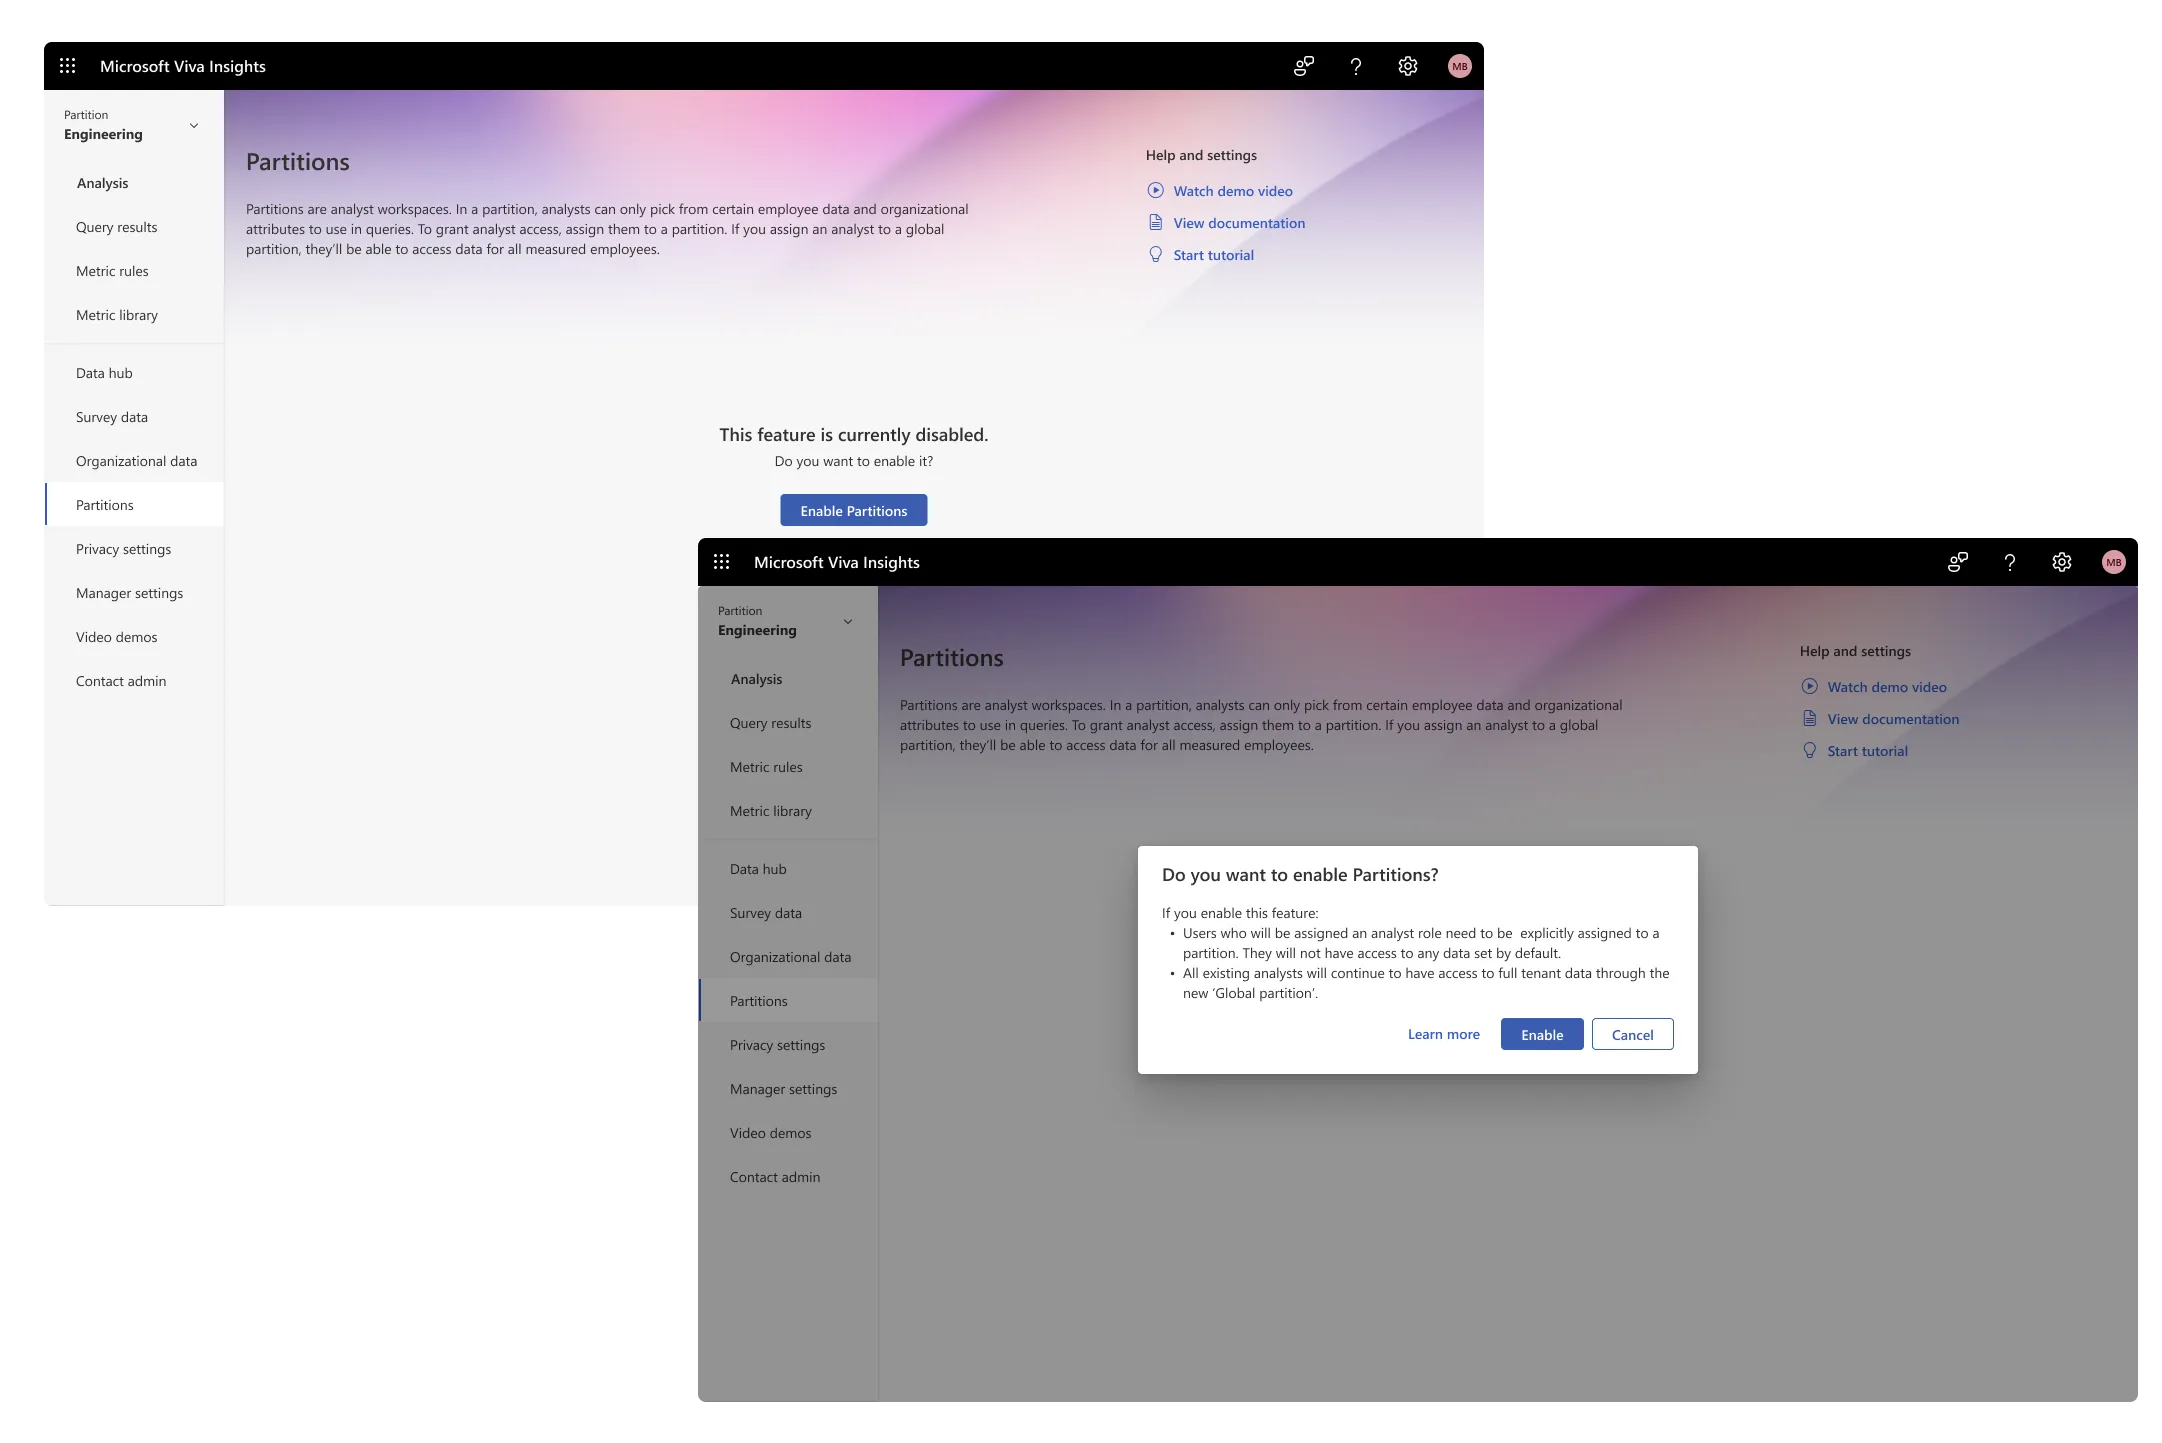
Through the Partitions homepage
We then explored an experience where the admin can enable the setting through the Partitions homepage. This gives the admin an explicit message on what will happen when Partitions is enabled for their tenant. The problem with this approach was that since Partitions is an opt-in feature and a highly data-sensitive one at that, the team did not prefer the idea of keeping the Partitions tab easily accessible.
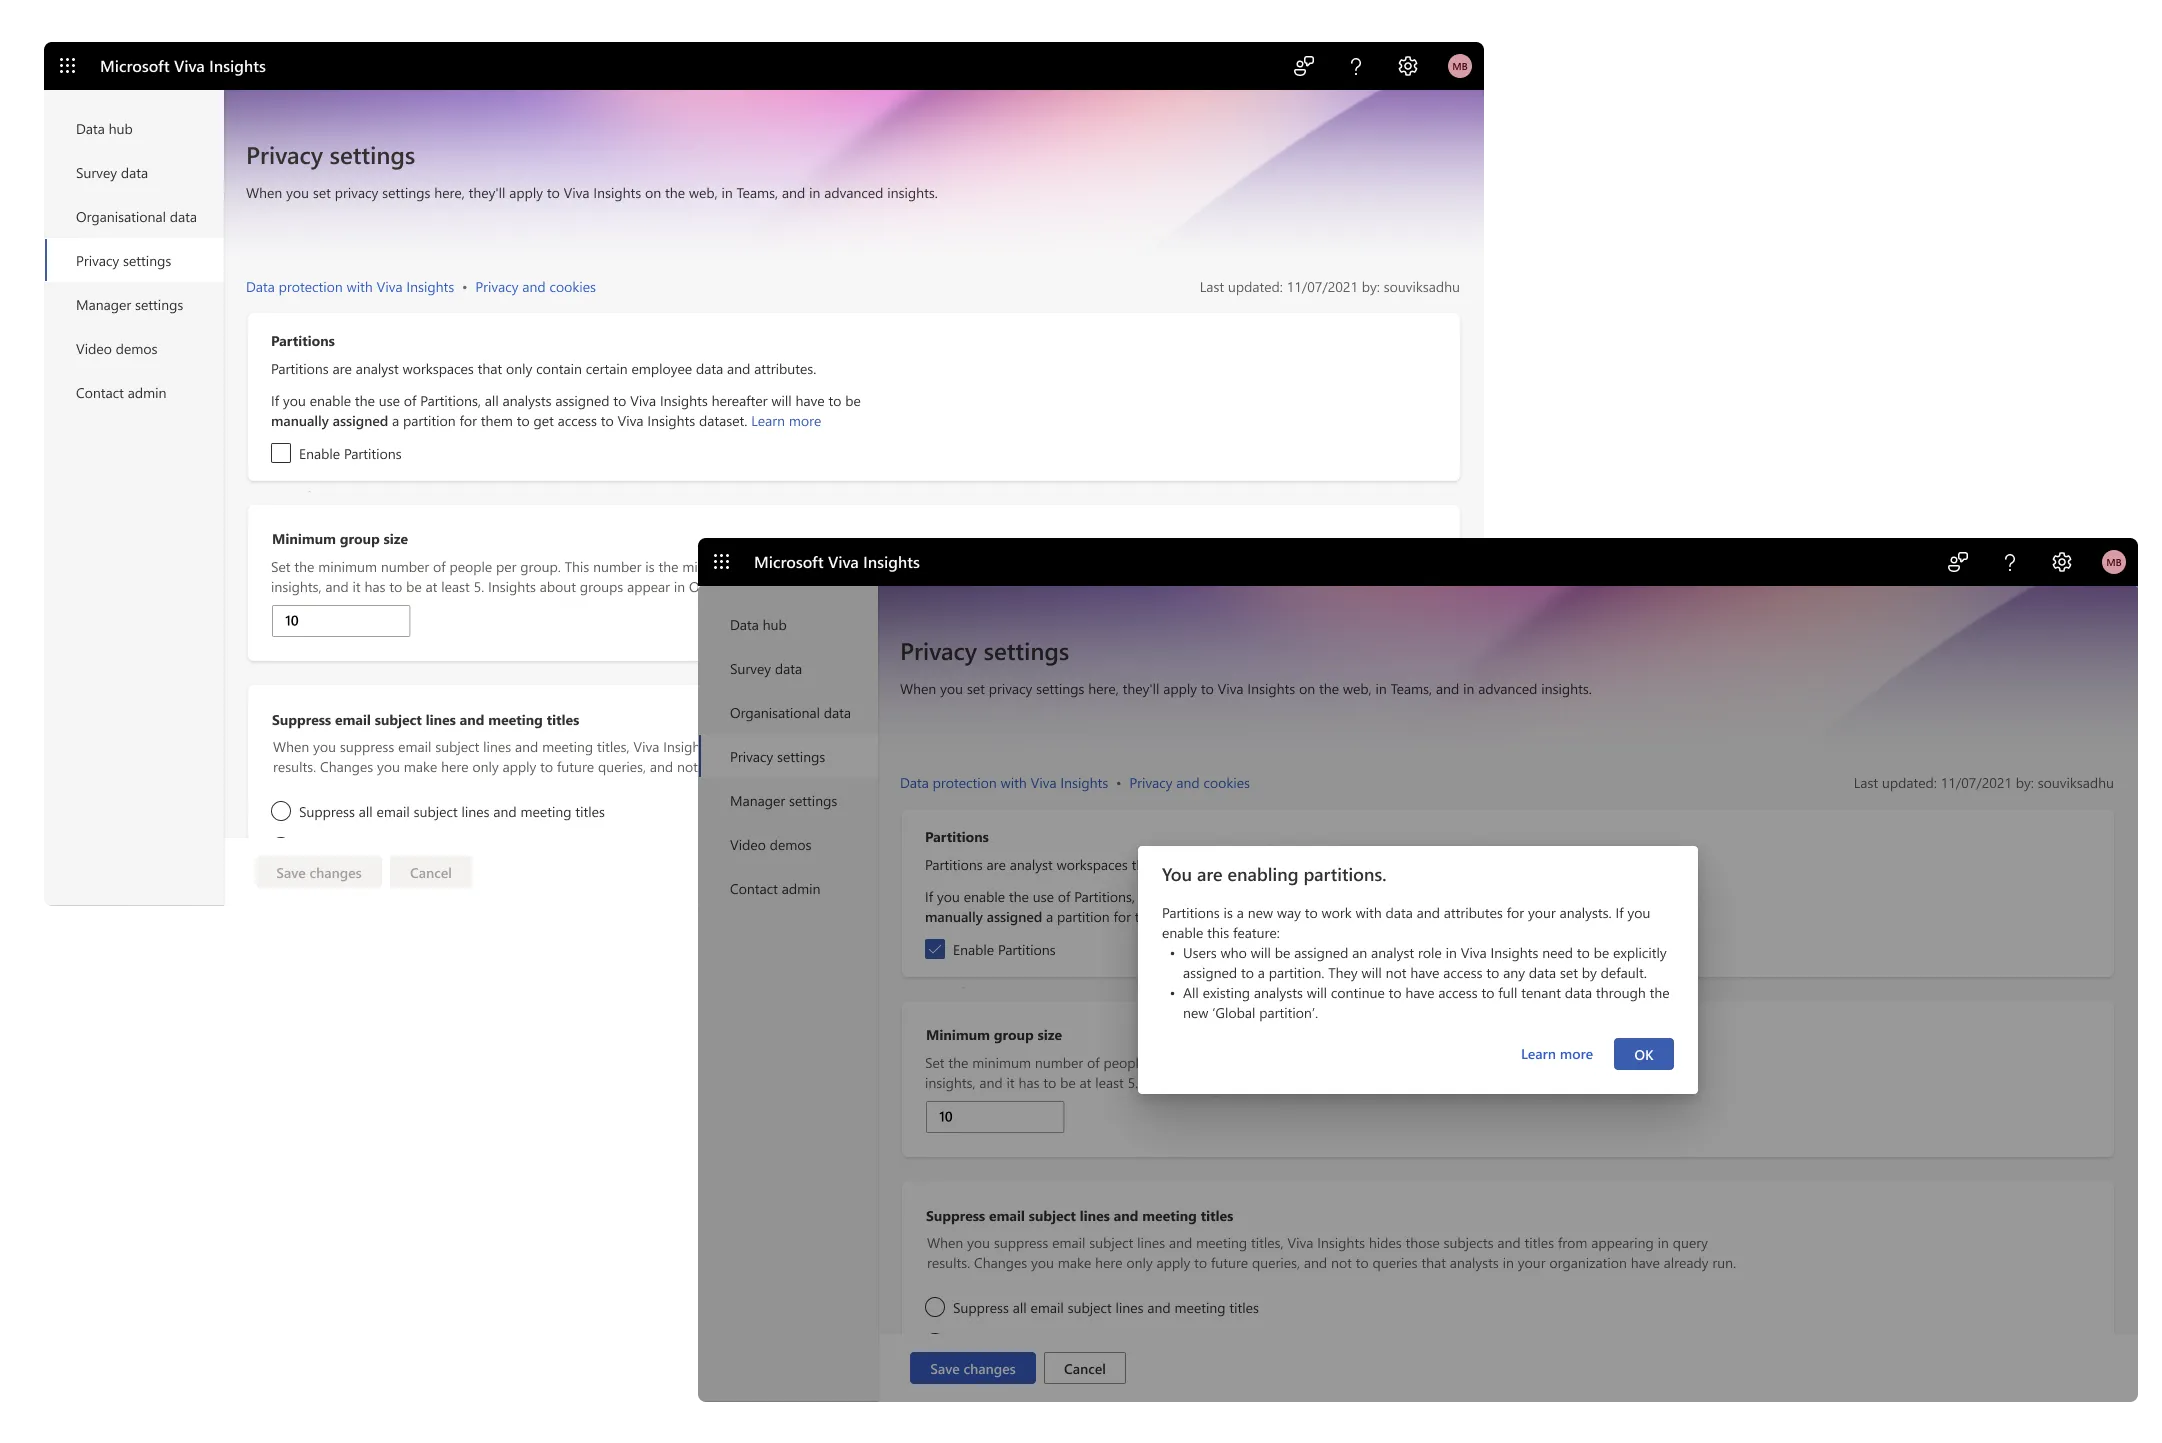
The privacy settings page
This brought us to the final experience that got shipped. Here, the user has to navigate to Privacy settings and toggle on Partitions to enable it for their tenant. Once toggled, the user is presented with an info modal explaining how it will affect the tenant. Finally, as an additional measure, the user has to click on ‘Save changes’ to confirm the enablement of the feature.
The final designs
What got shipped out finally.
The explorations really shaped where we landed. What we shipped kept the original feel of WPA, but built newer features on top.
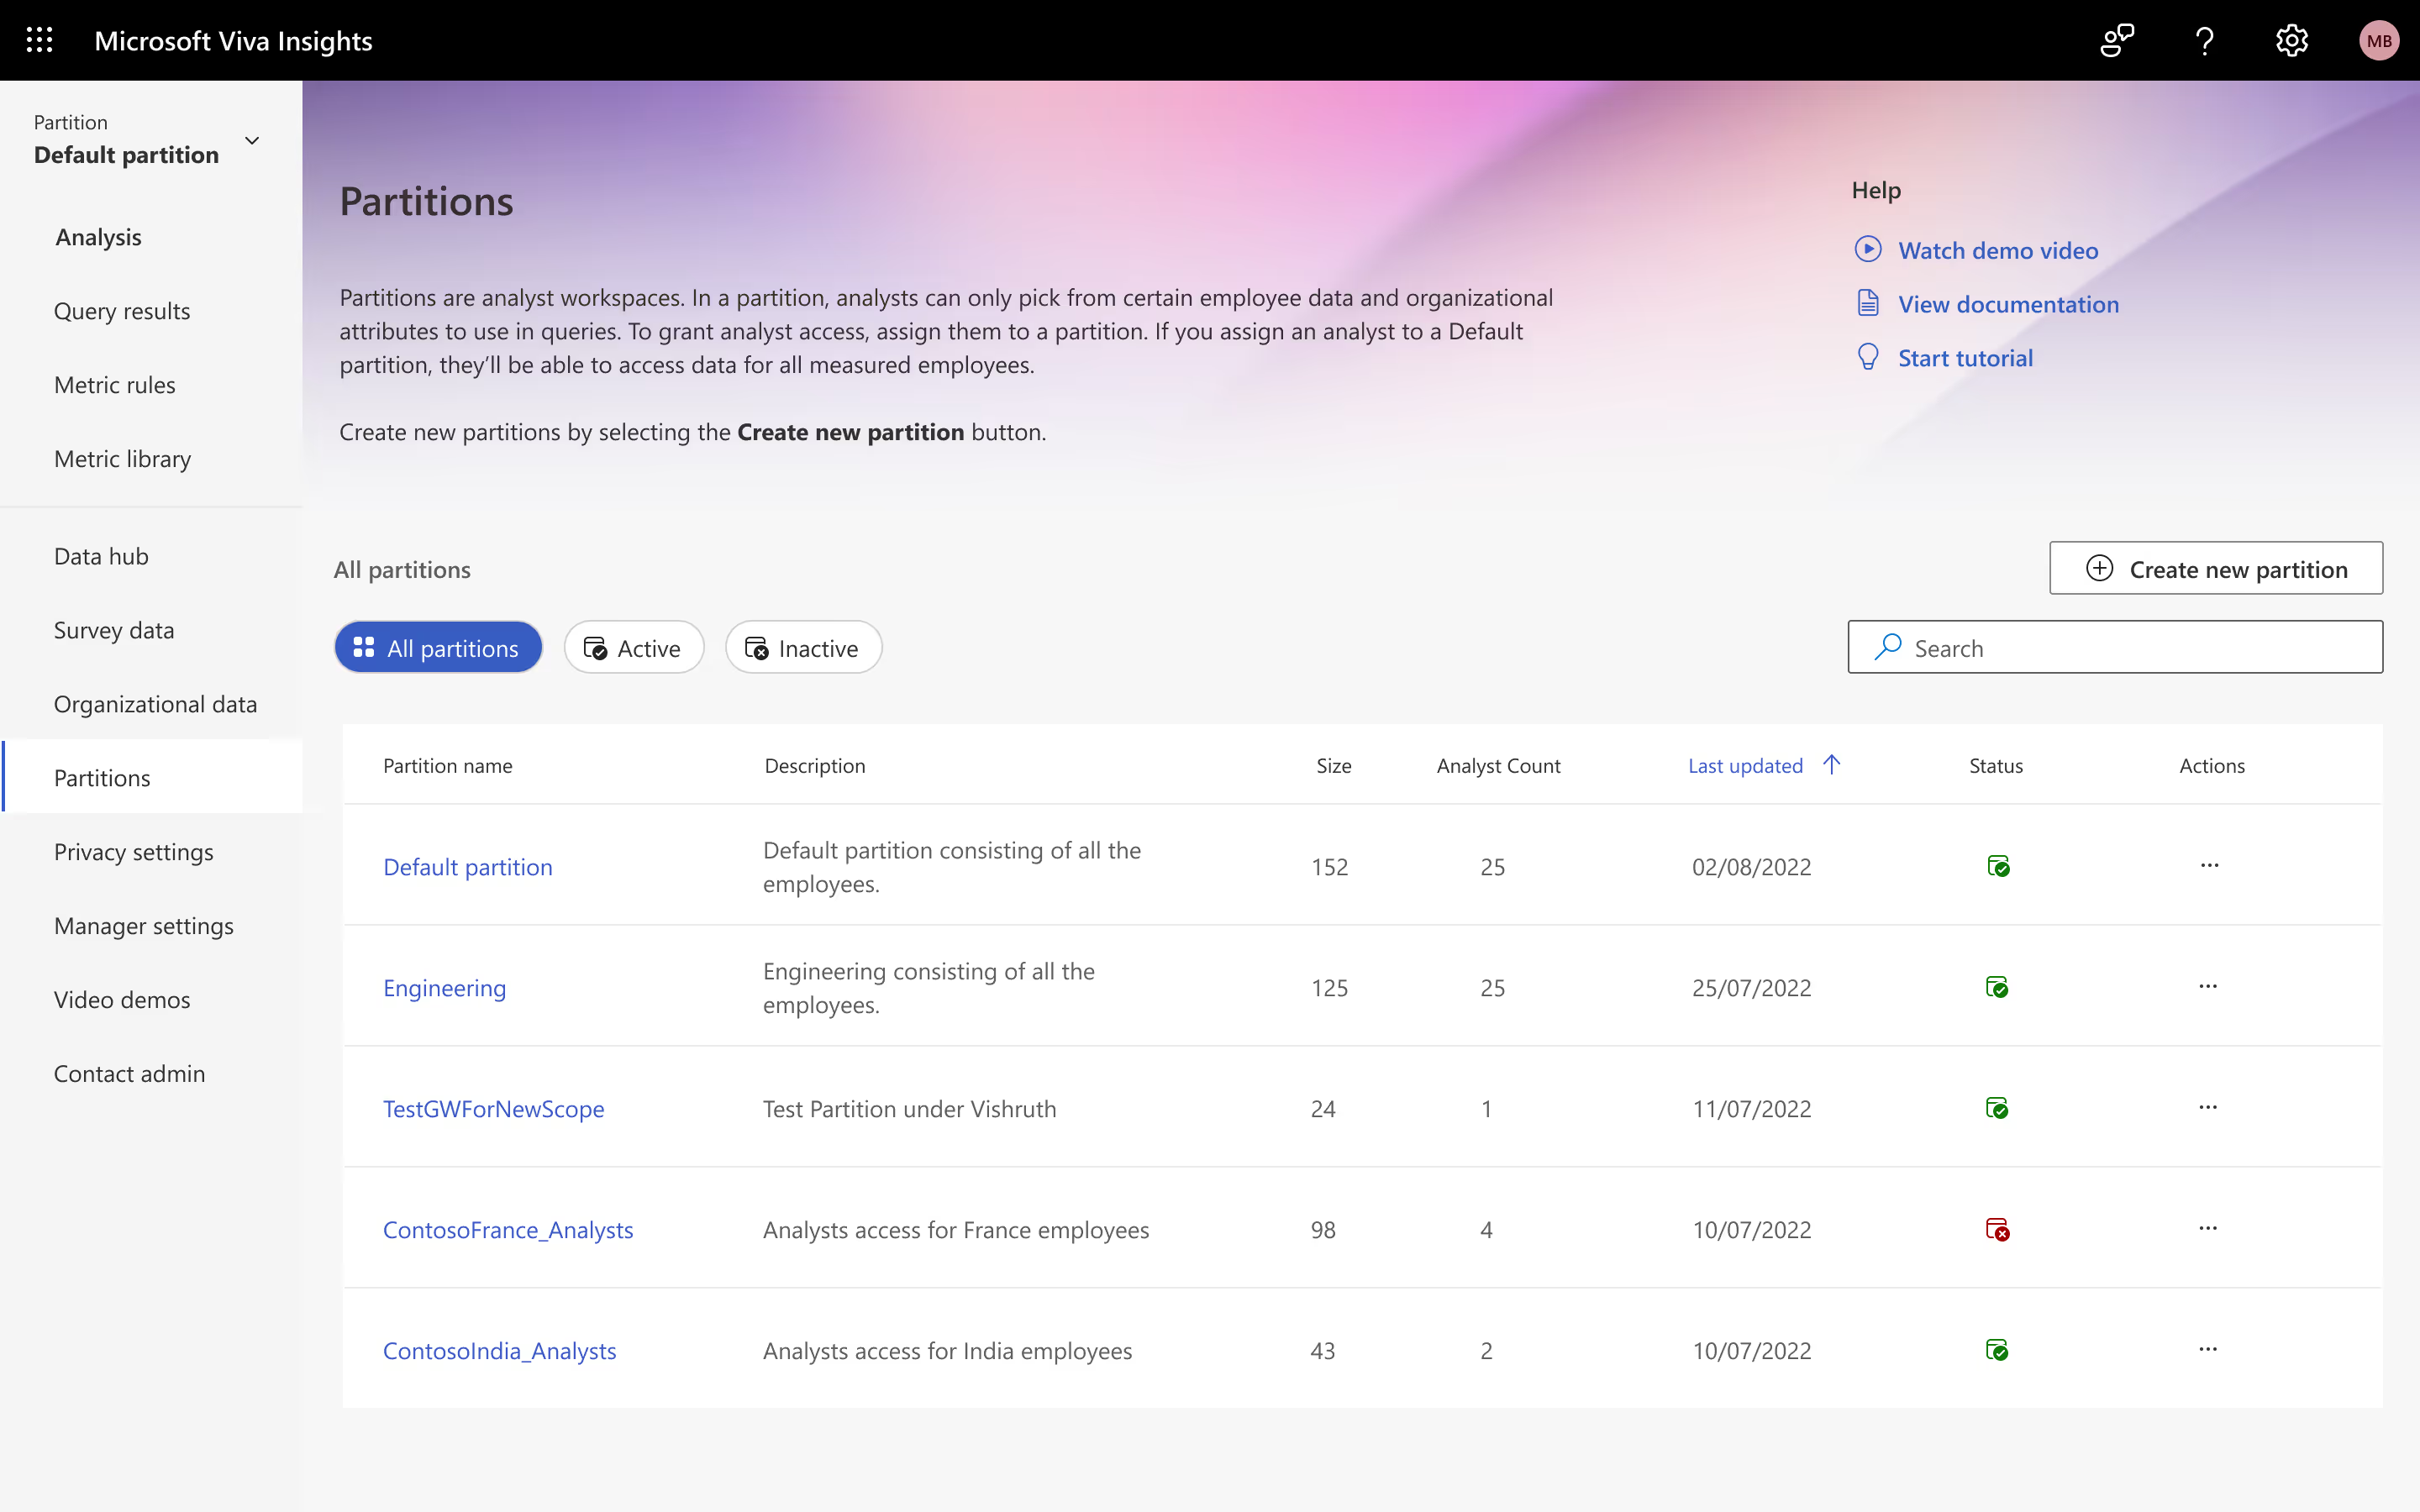
The Homepage

The homepage lists all the partitions the admin has created. The banner stays compact and leaves room to focus on that list. They can filter partitions with the pills above the list, sort from the table, and search when the list gets long. If the admin wants to create a new partition, they can click on the button above the Search and get started with the Wizard.
Filtering employees
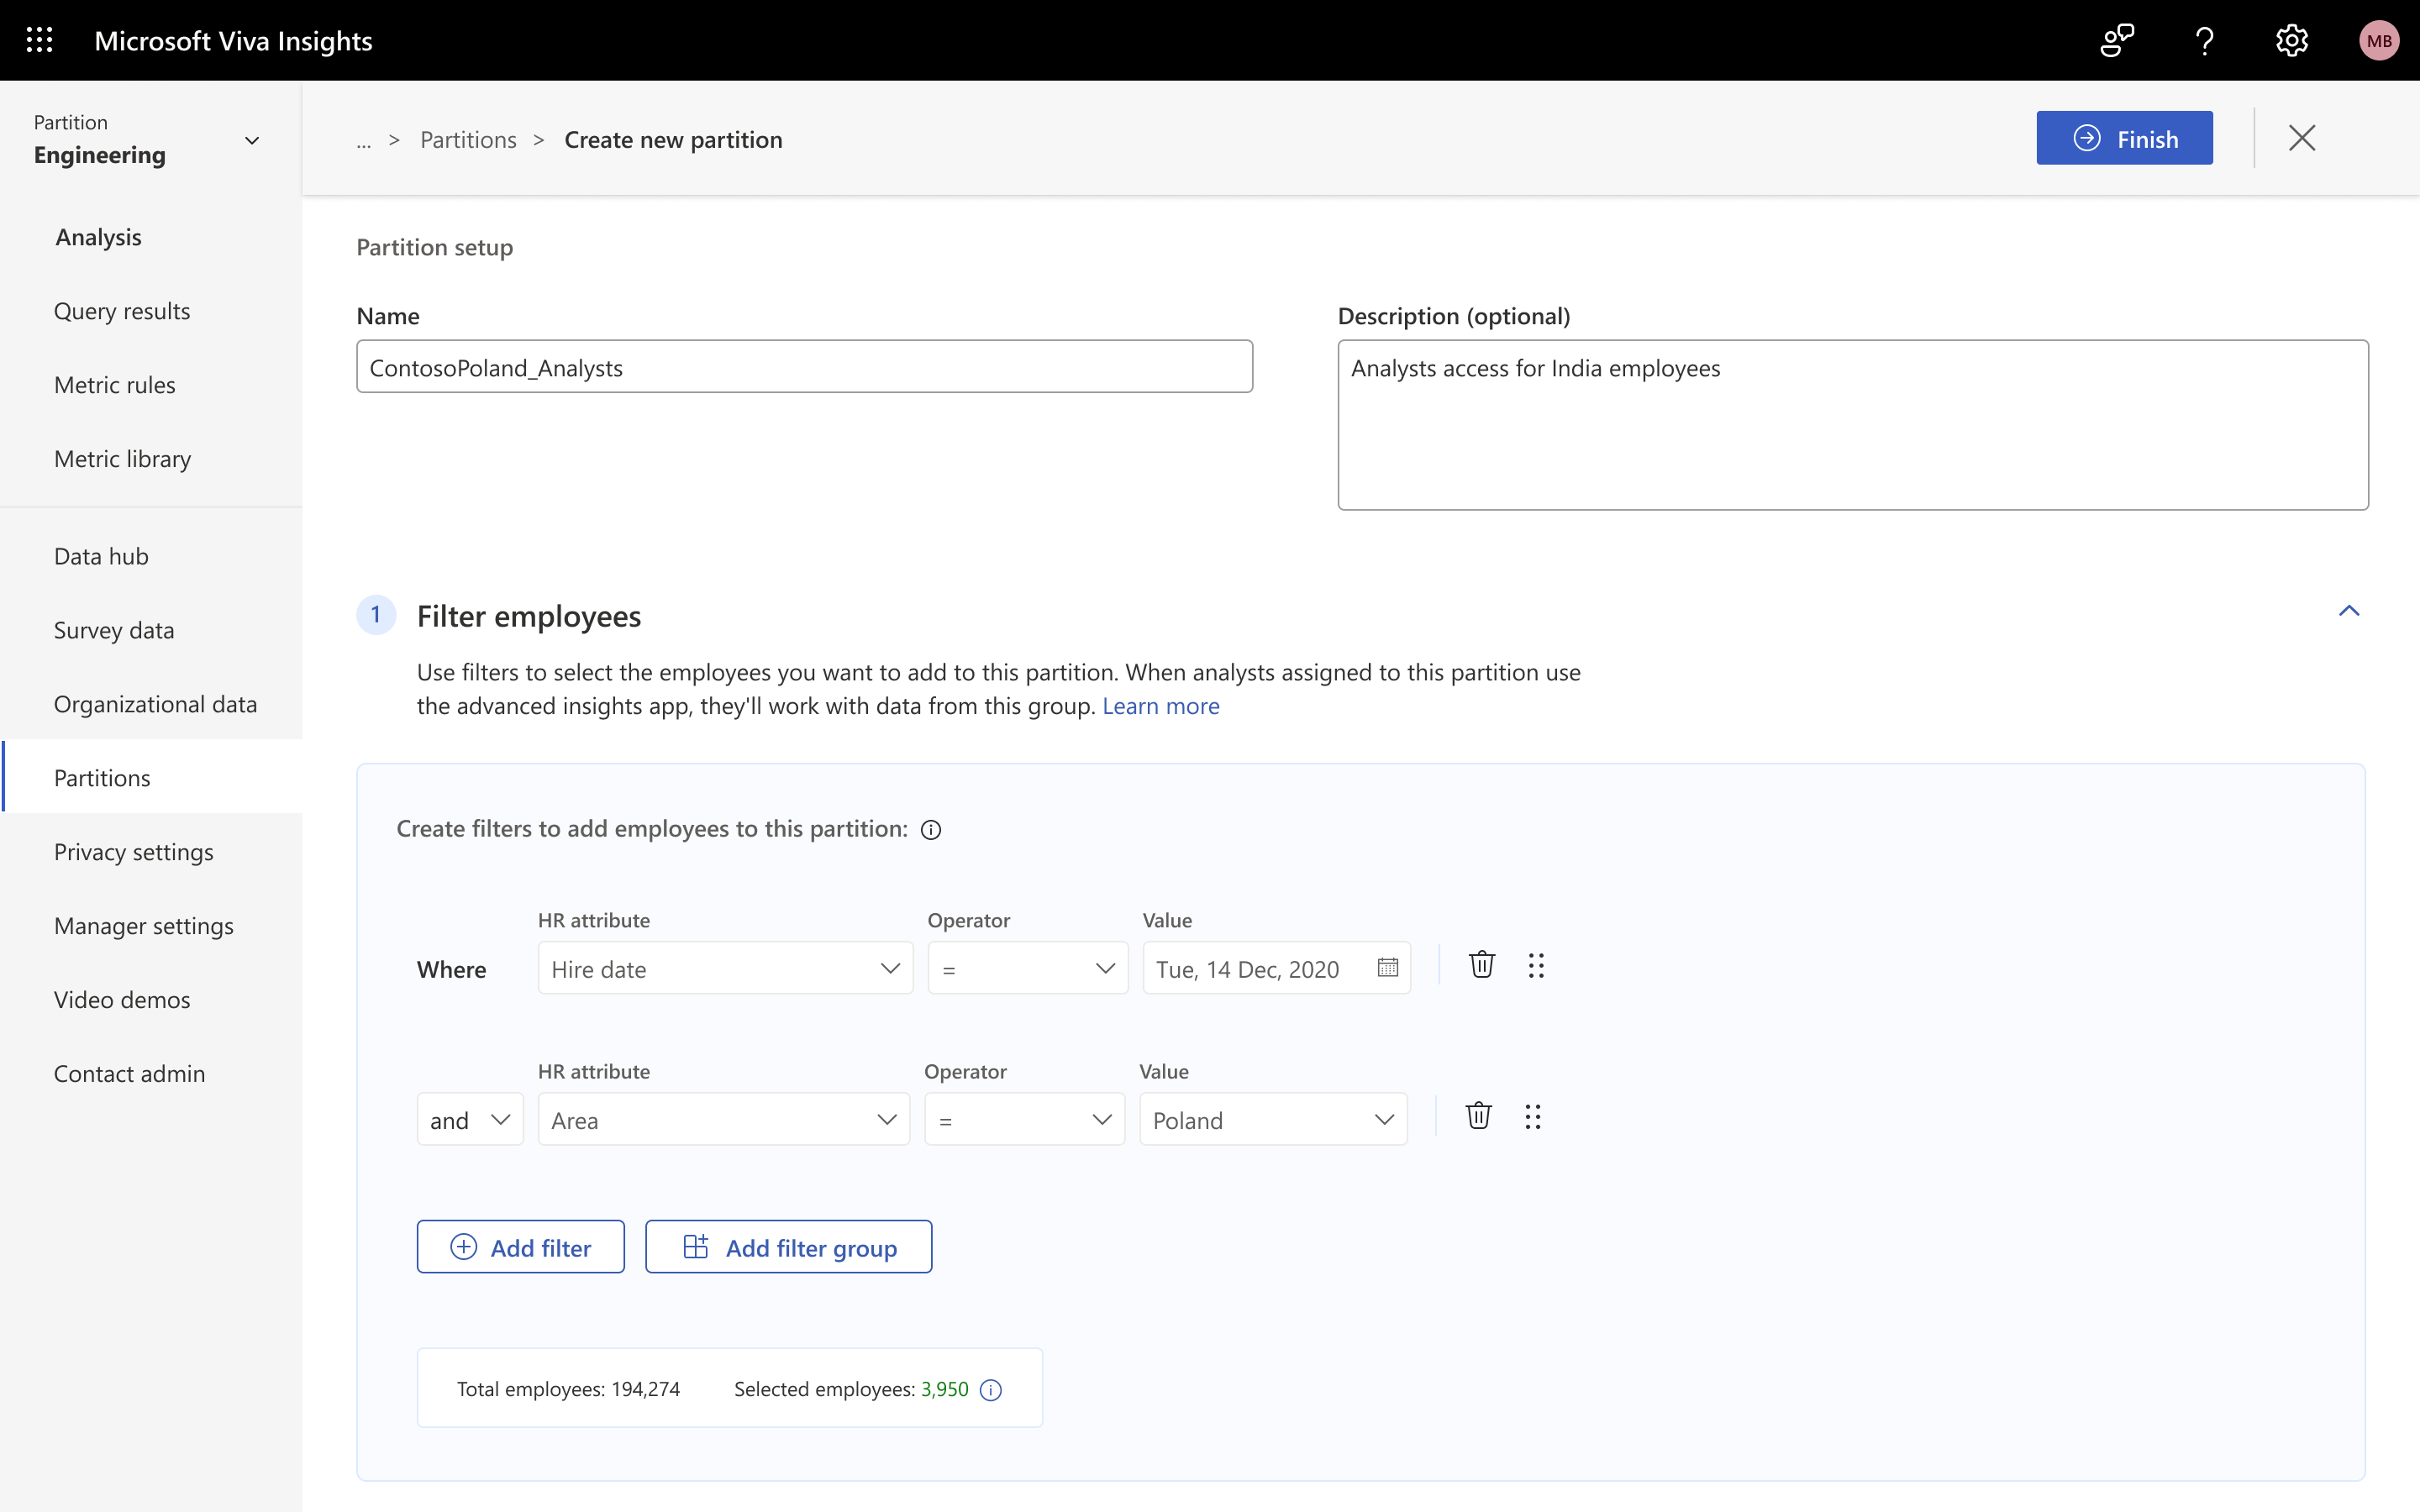
Since the SUS testing showed a single-page experience worked better, the Create a Partition wizard is scrollable. The filters pane now has a nesting selector, and the measured population is much easier to see because it’s grouped under the filters. Users can also rearrange each filter, which wasn’t possible before.
Selecting attributes
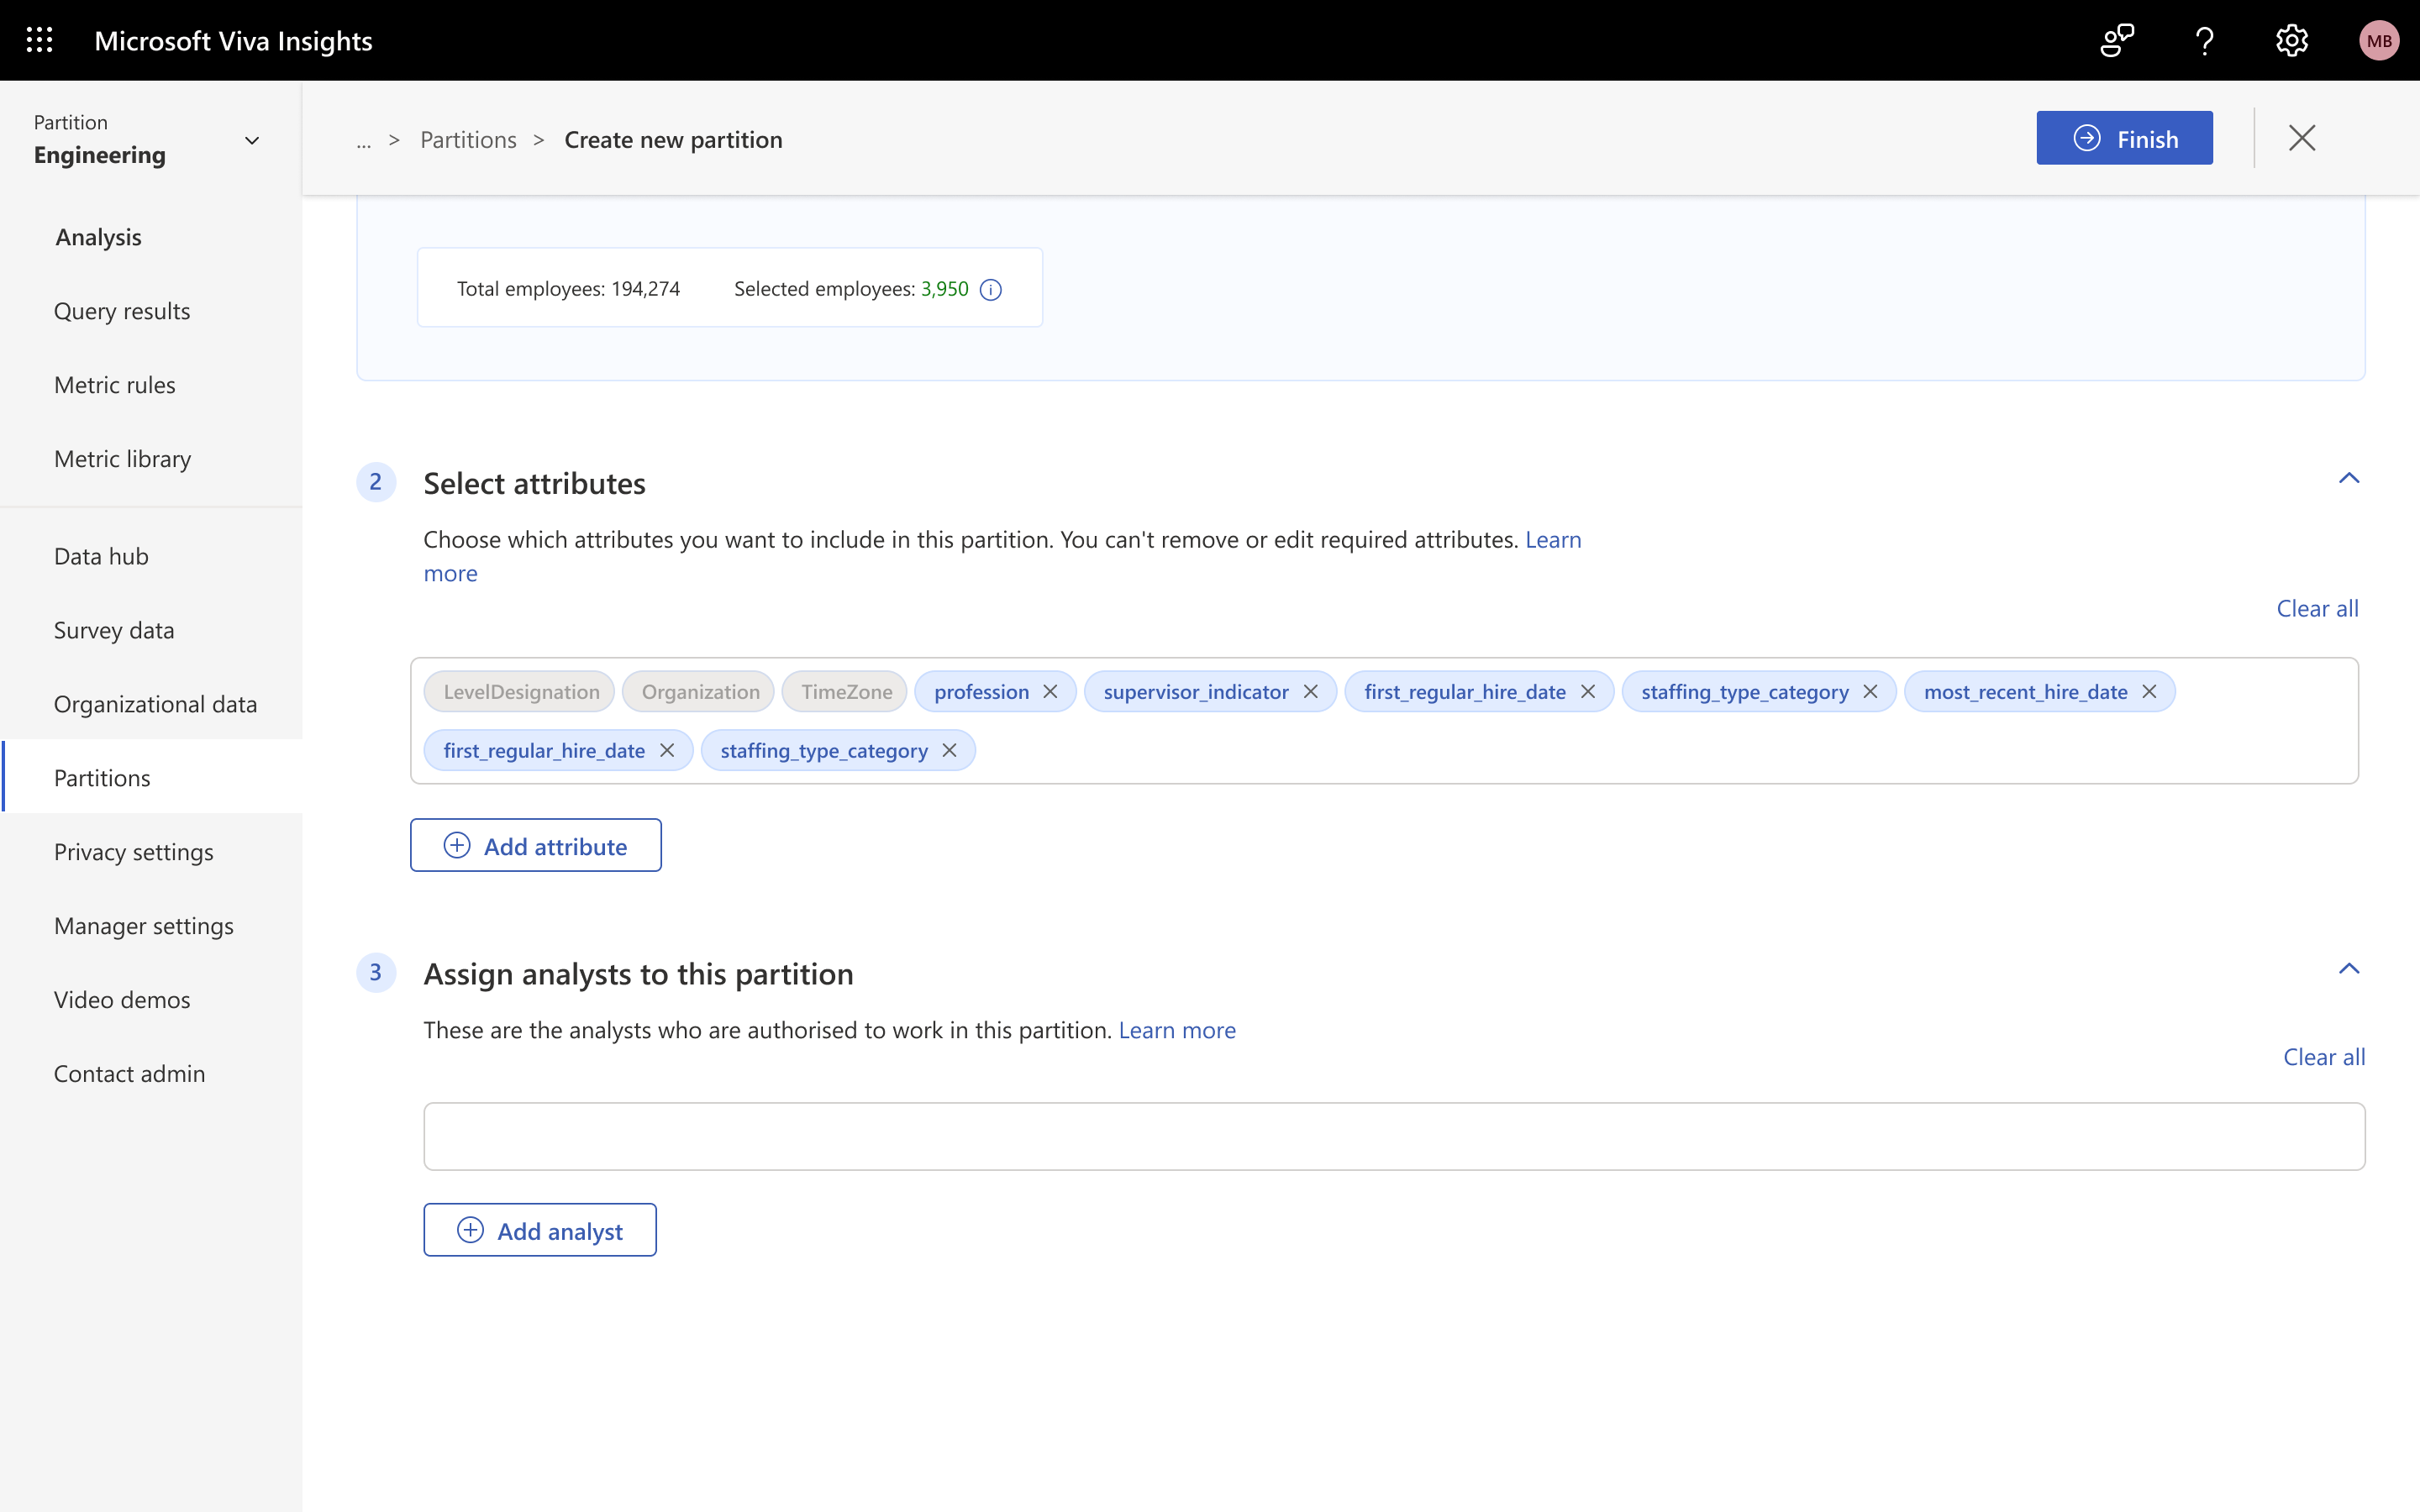
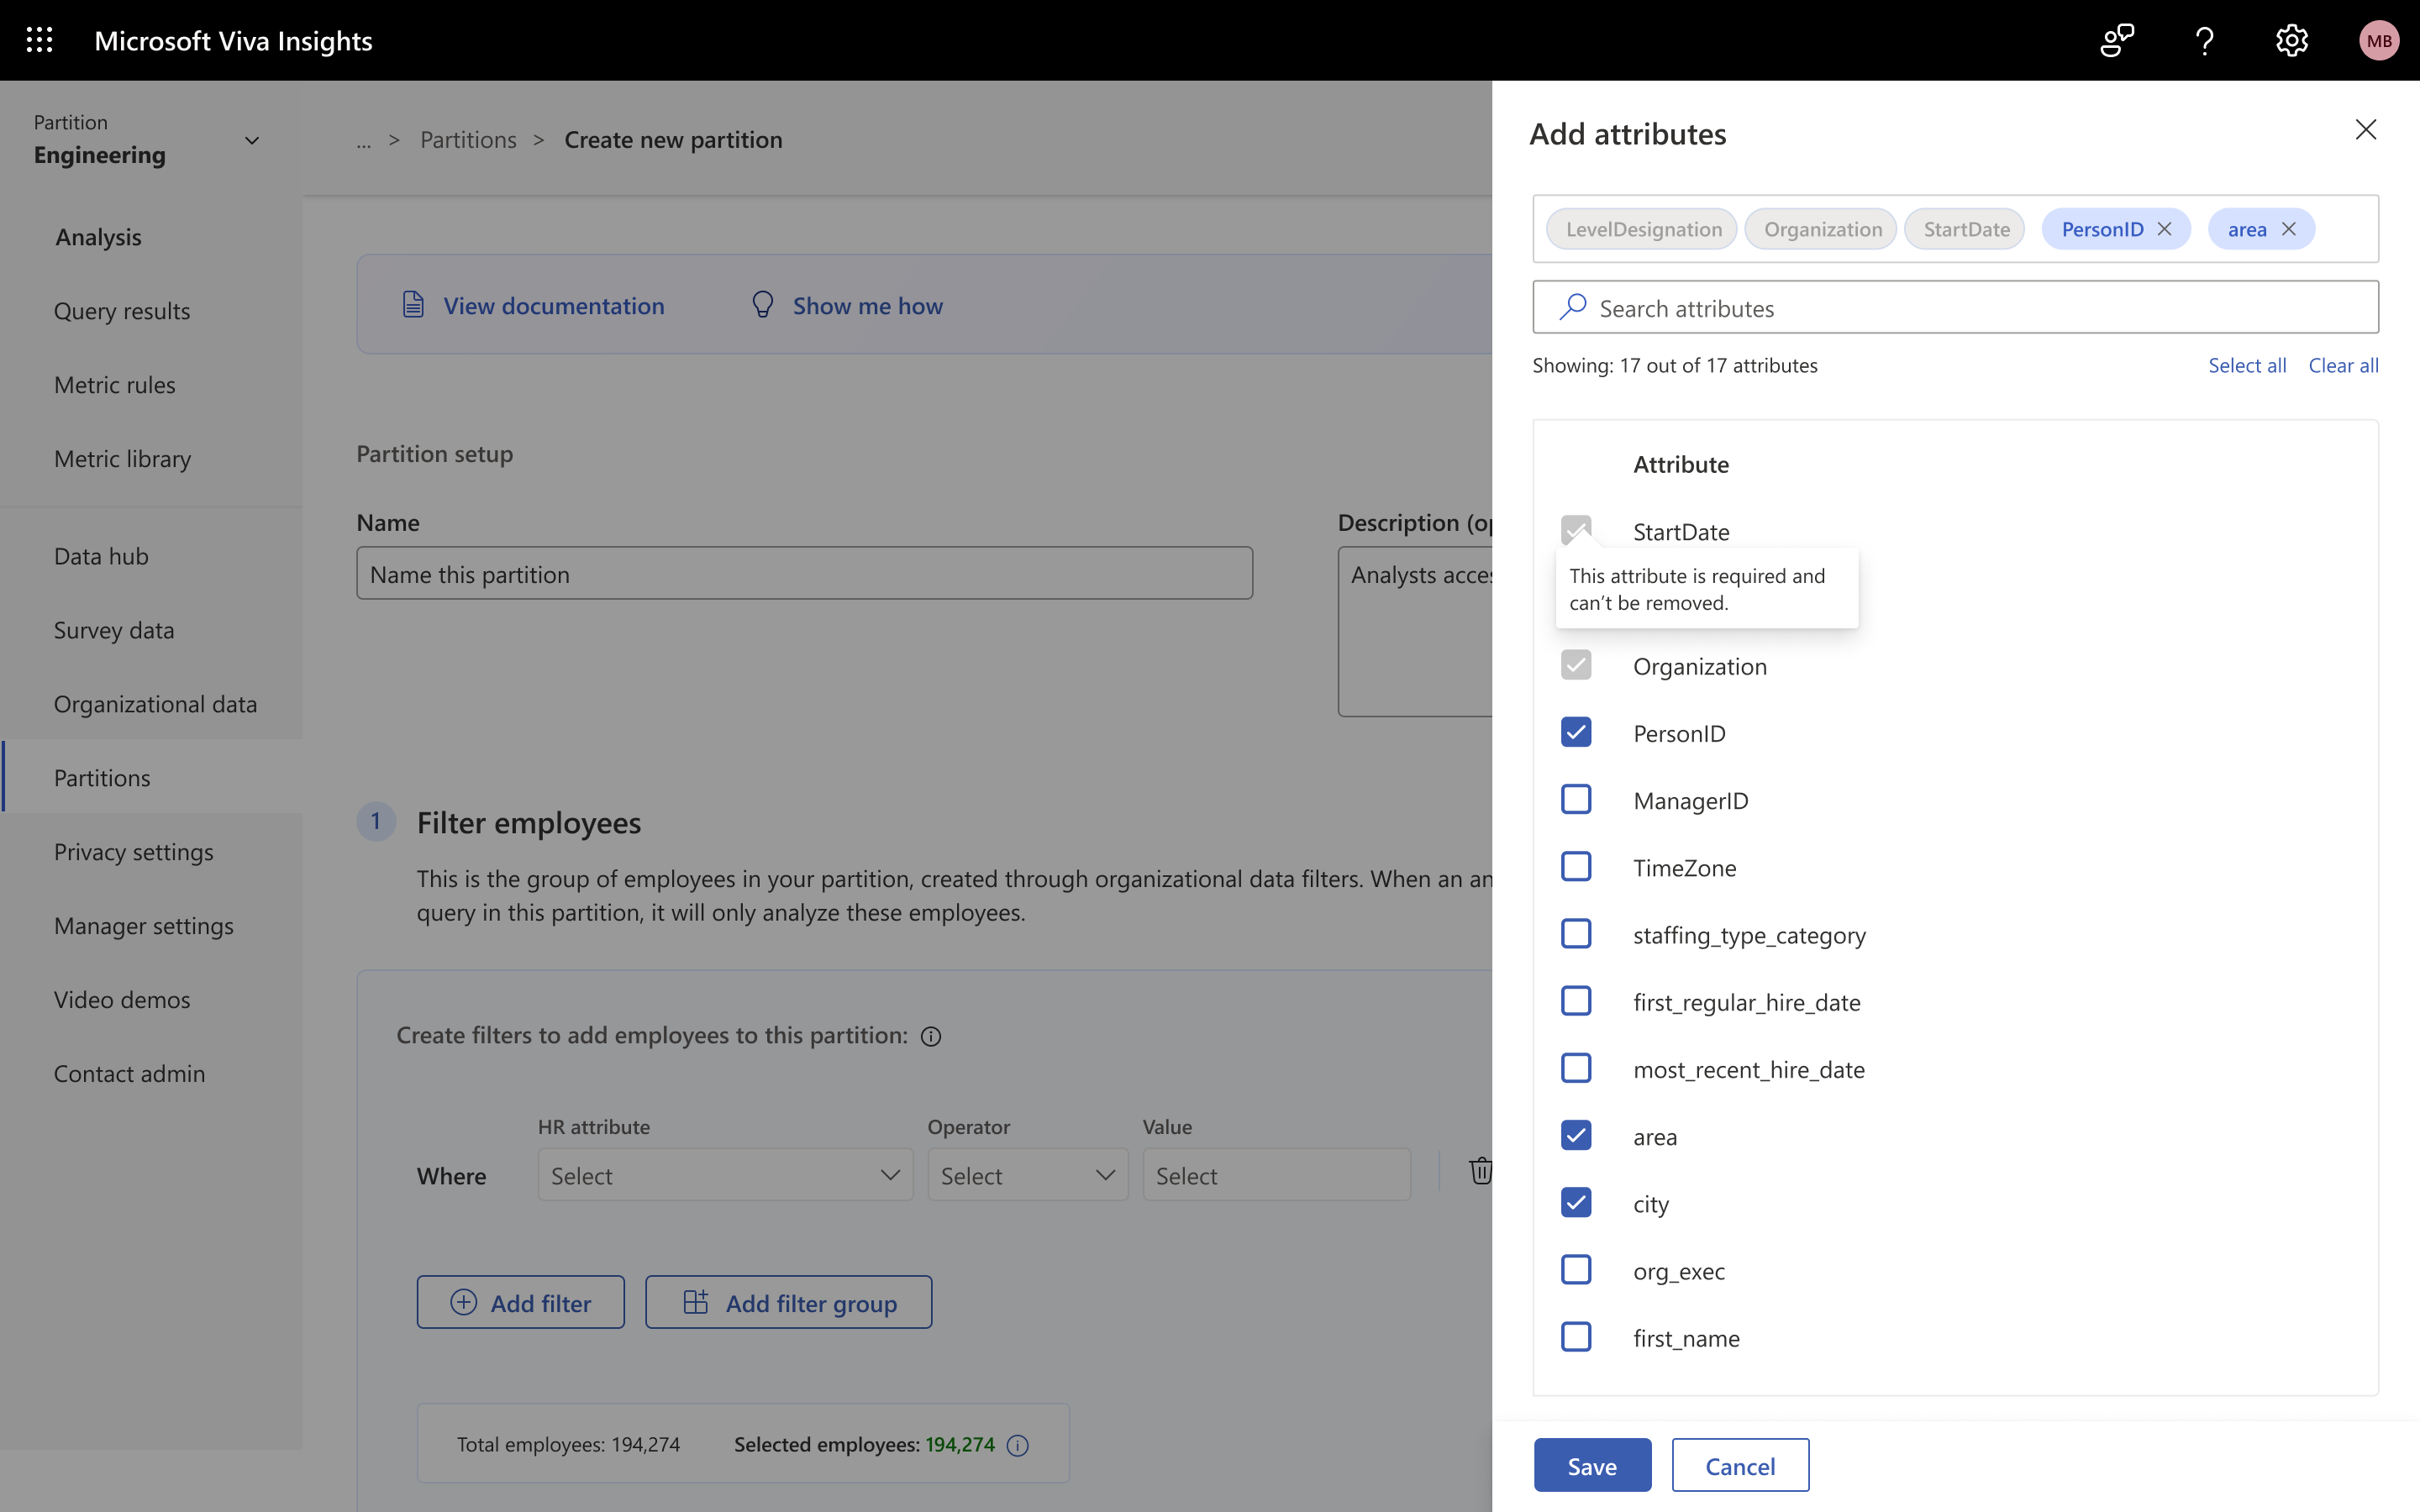
The attributes are now shown in pills, through which the admin can easily see what they have selected without having to scroll an endless list. Clicking on 'Add attributes' opens a flyout where they can easily find the right attribute they're looking for.
Assigning analysts
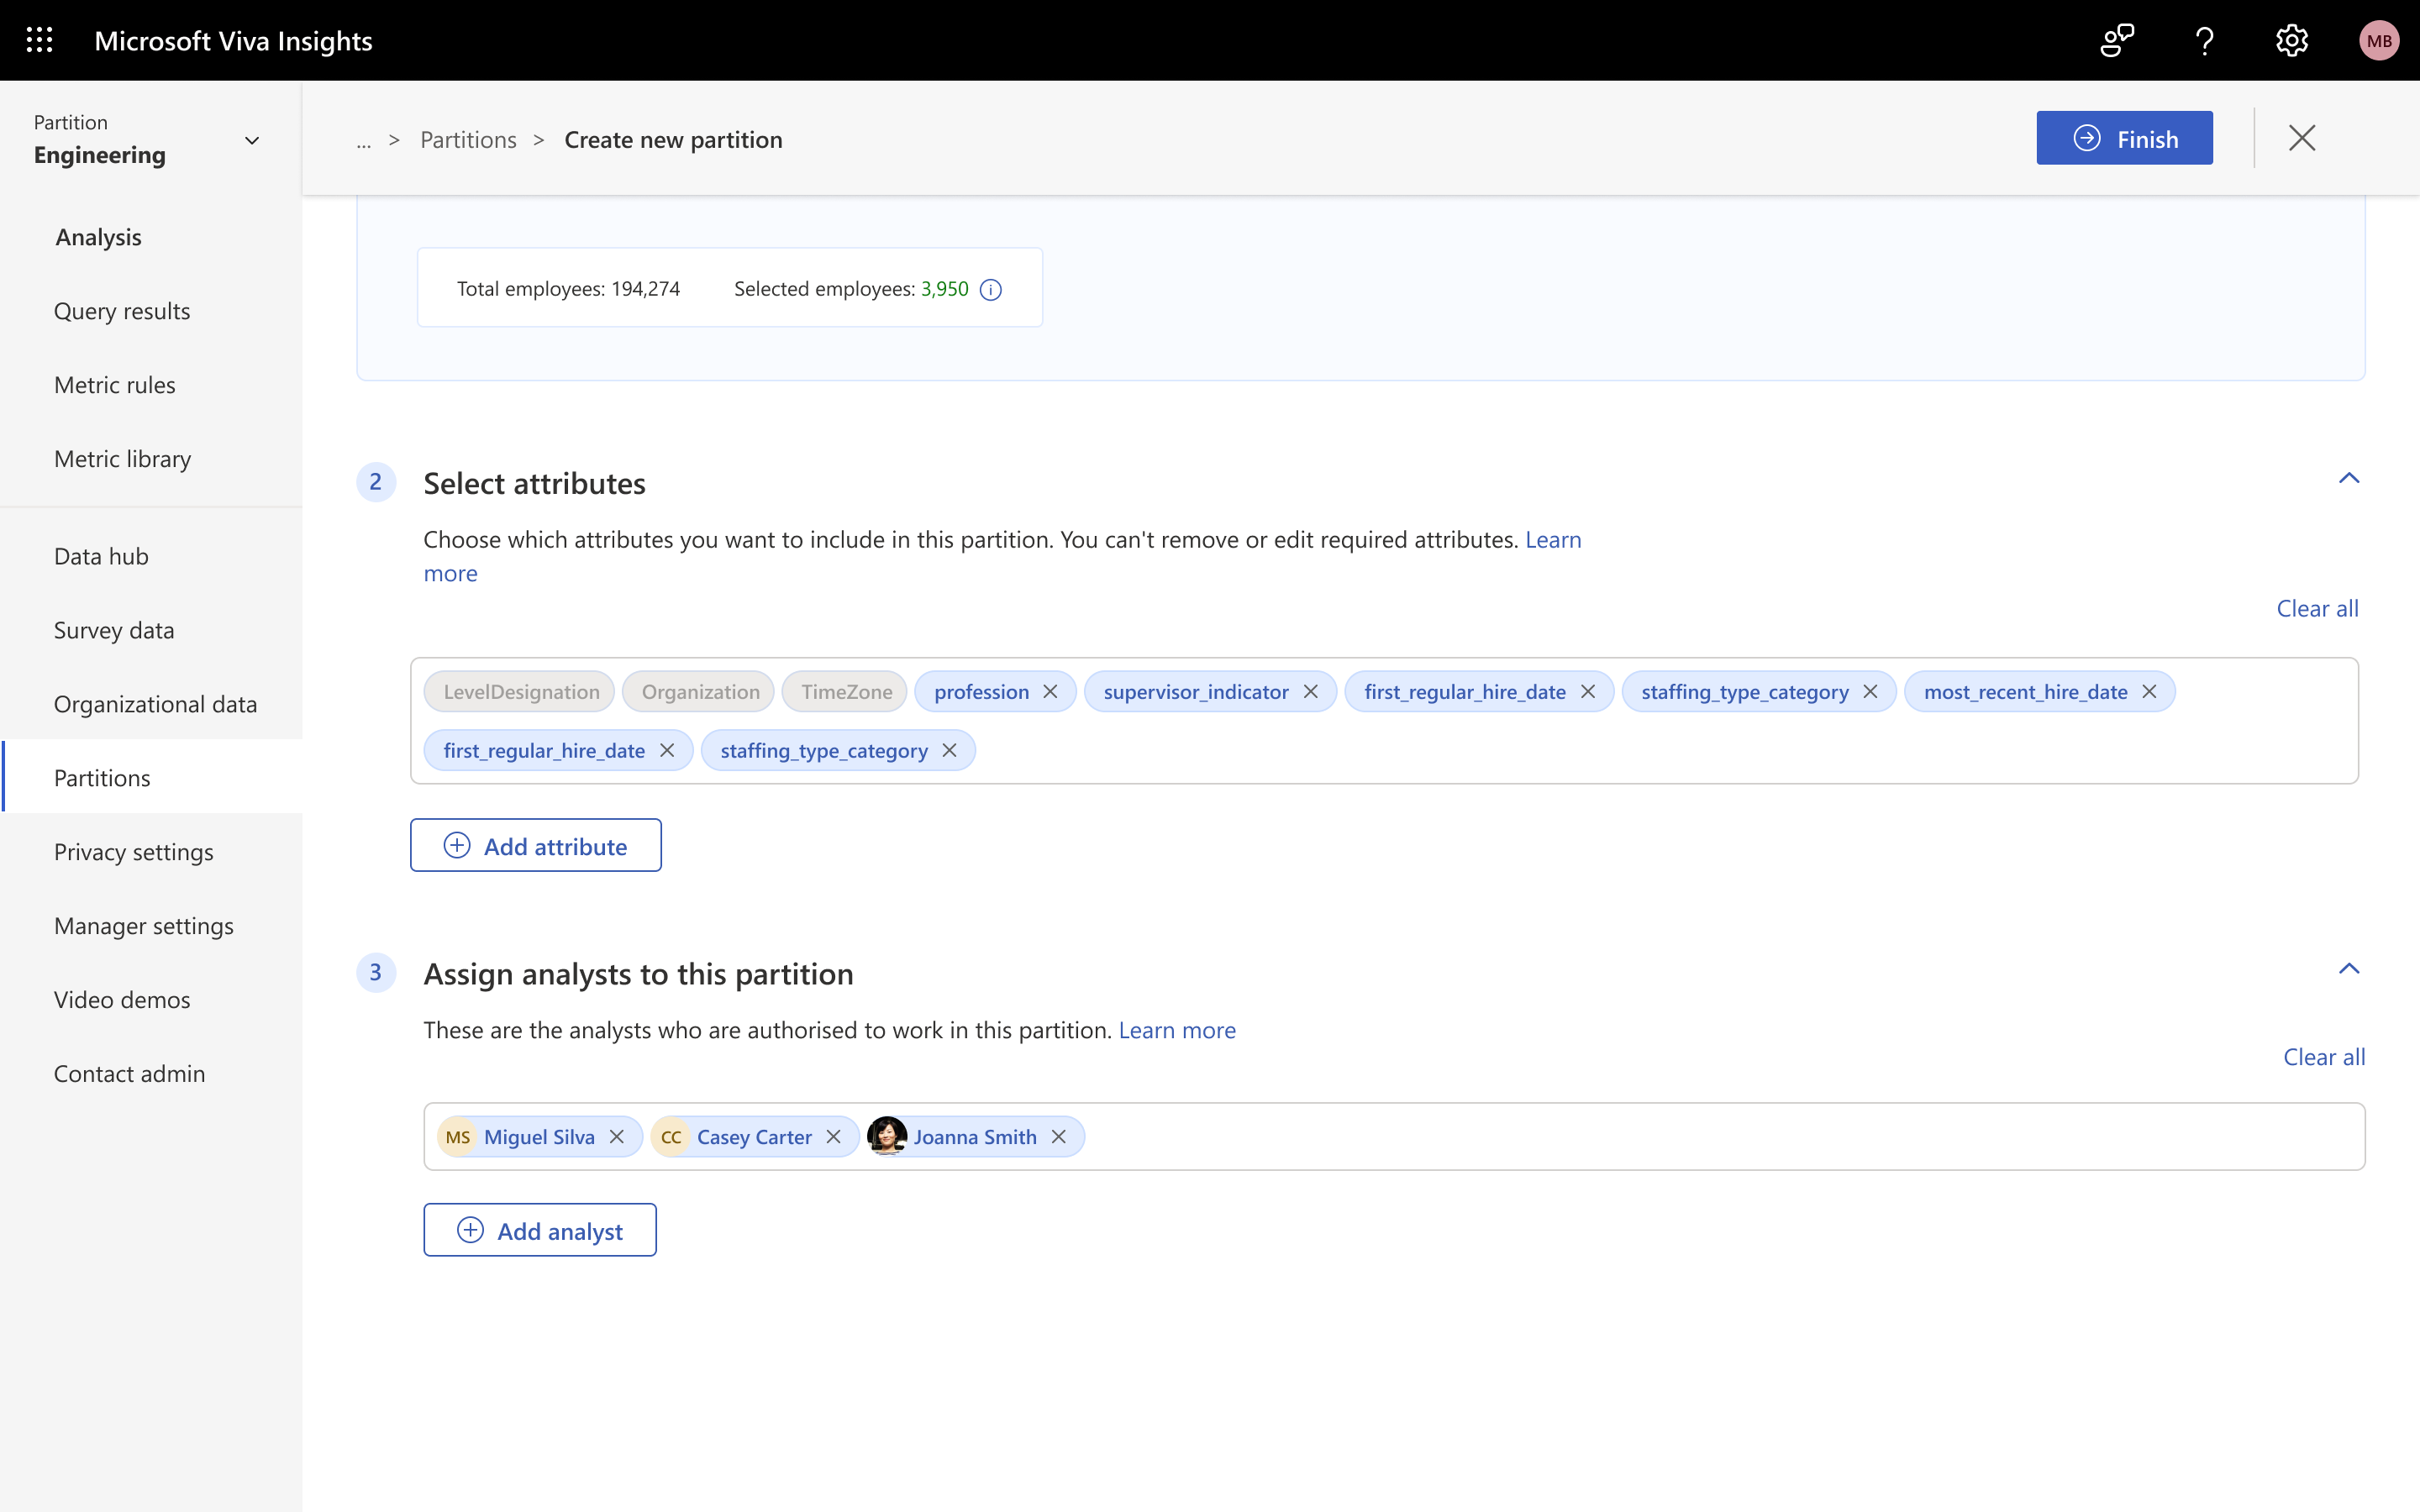
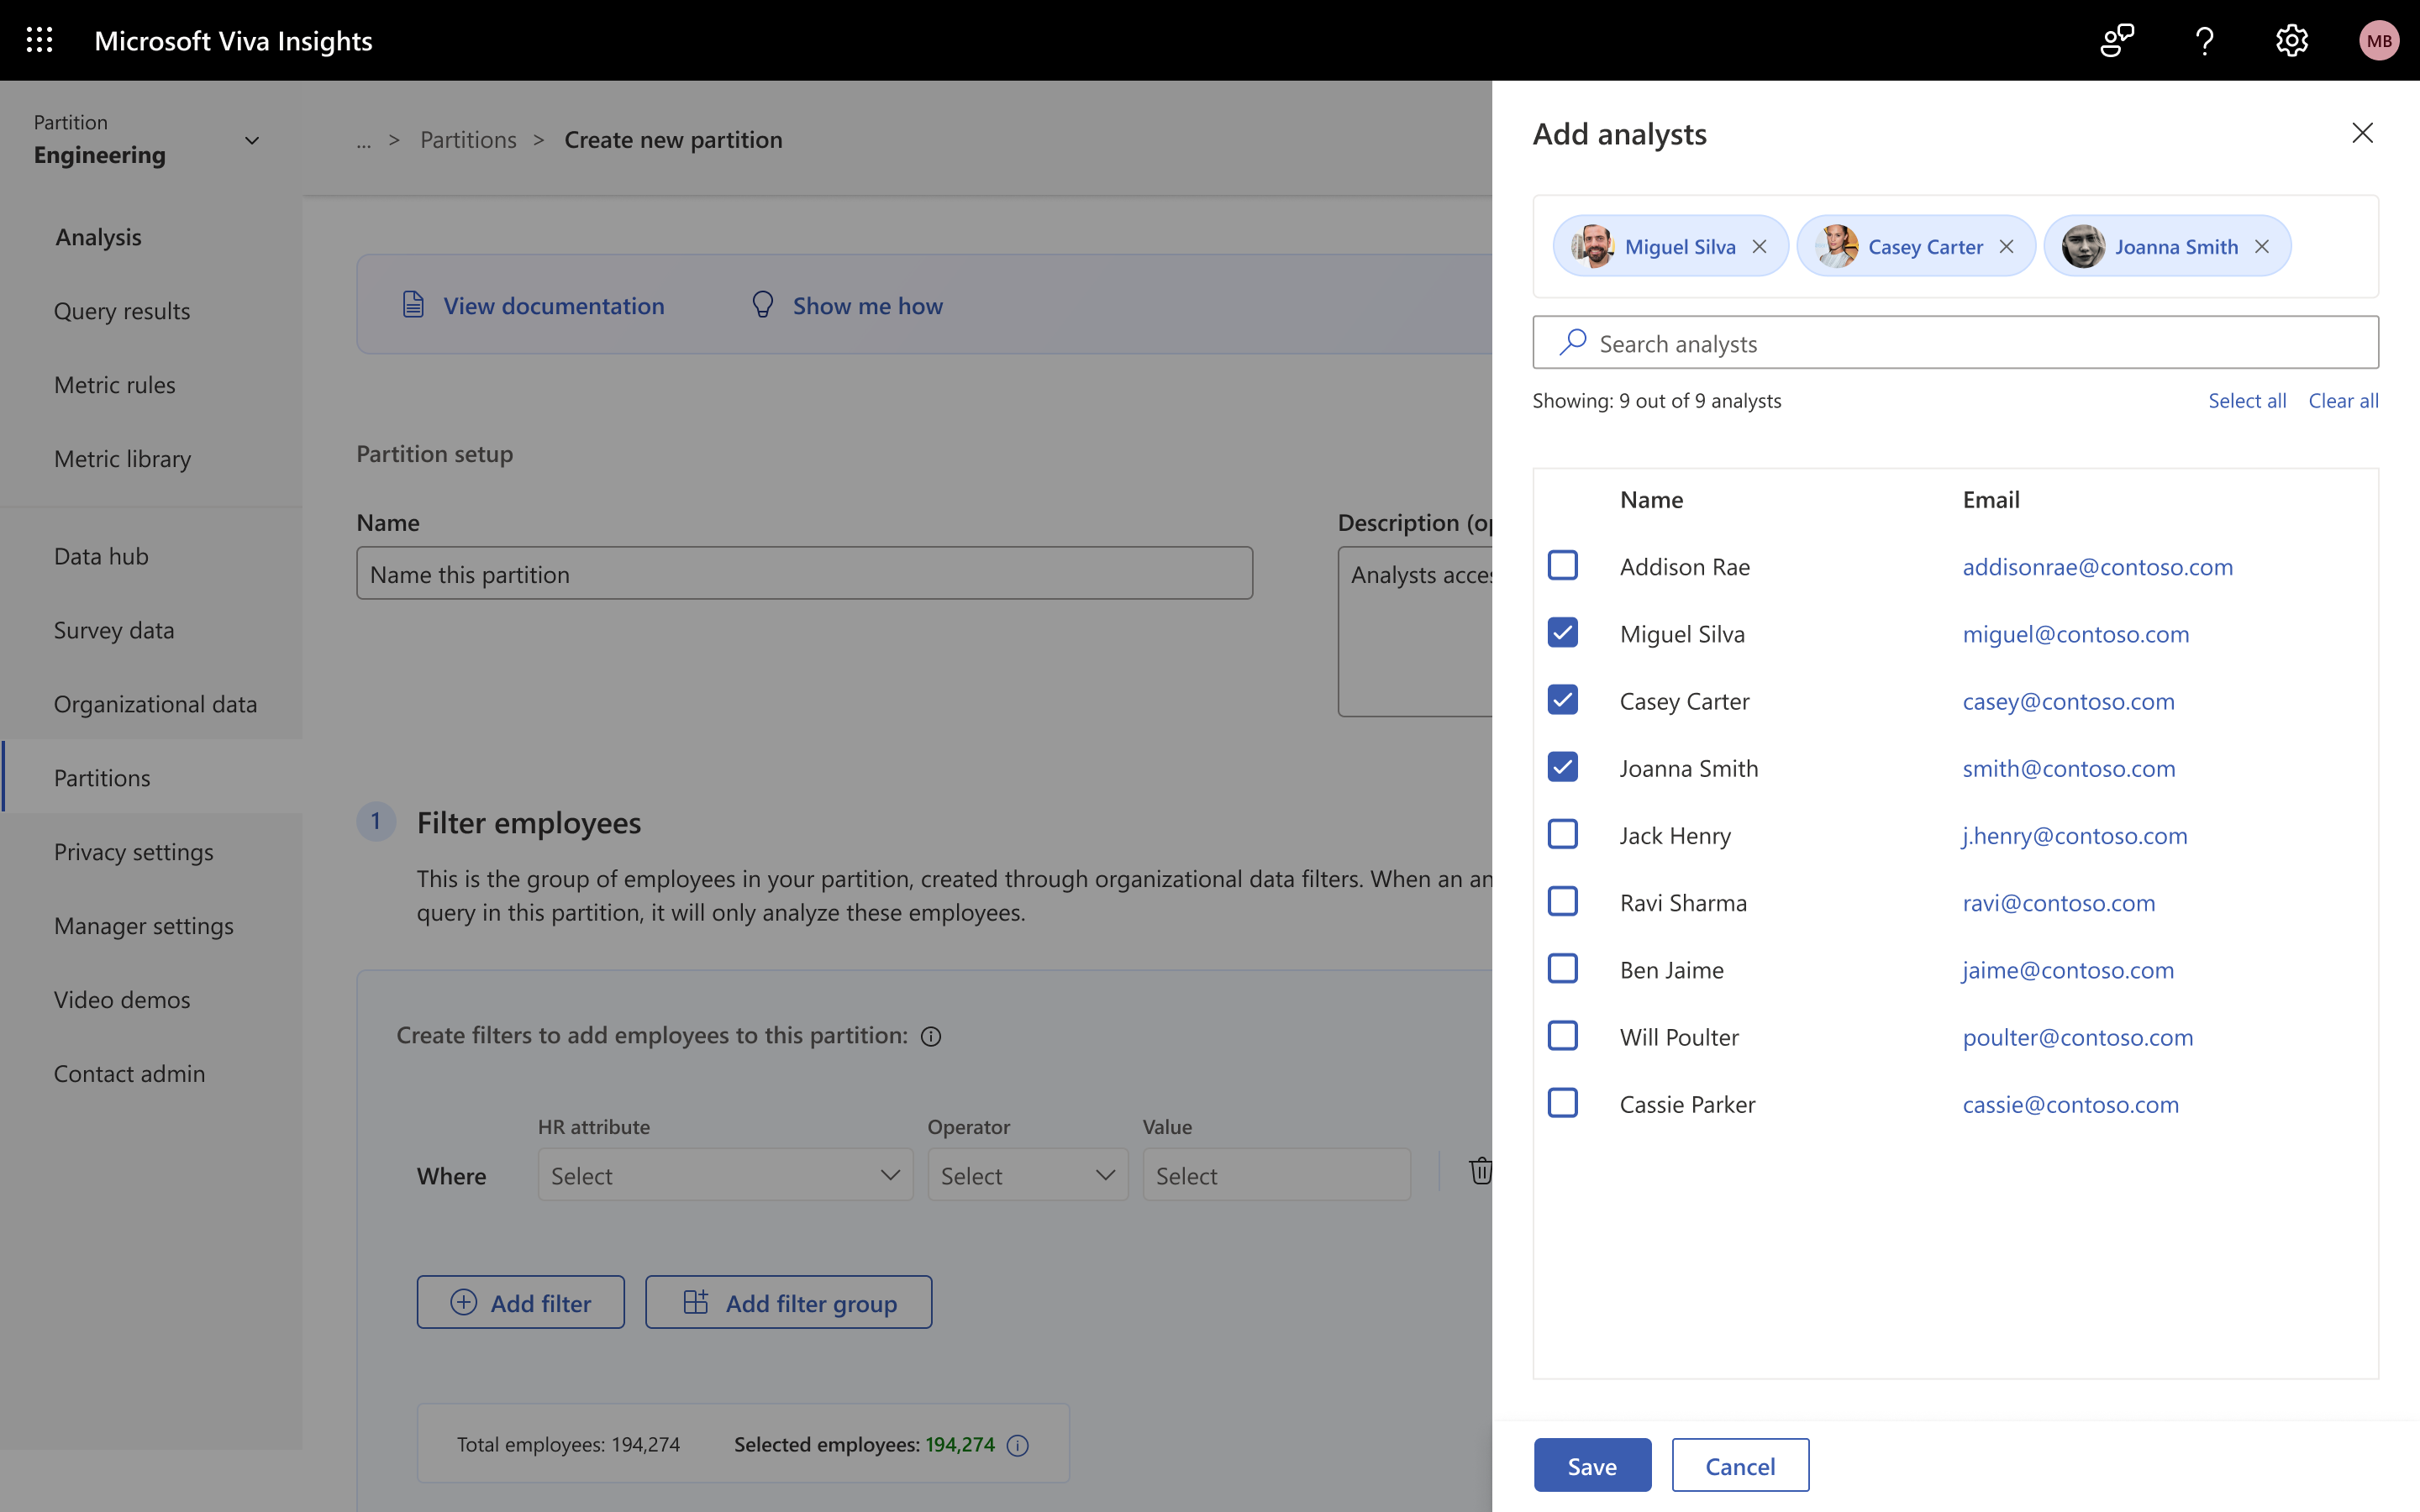
The last step is to pick the analysts who get access to this partition. These pills look different from the attribute pills, to signal that they’re people. Similar to the attributes flyout, the user flyout helps the admin find the right analysts, with avatars and email addresses to identify them.
What I took away
The riskiest part wasn't the wizard.
The biggest design risk in Partitions turned out to be enablement, not the CRUD flow. Turning Partitions on changes how every analyst accesses data, so a heavy-handed rollout could easily have scared admins off the feature entirely. Testing three onboarding paradigms and landing on the privacy-settings toggle, which is explicit, opt-in, and has a confirmation step, is what let a genuinely privacy-sensitive feature reach 70+ tenants without much hand-holding.
It also reset how I scope enterprise work. For admin-facing tools, the thing that usually slows adoption is trust and change management, not the interface itself.